Once a log source has an ingest key, the source system sends events to DemandFlow's ingest endpoint. The contract is small and stable: a single POST, an HTTP header for the key, and NDJSON in the body.
Endpoint
The exact URL is shown in the key popout at the moment of generation, and again on the log source detail view in the Ingest Endpoint field. The URL is a stable Lambda Function URL. It does not change when you rotate the key.
Request format
POST {ingest URL}
Content-Type: application/x-ndjson
X-DF-Source-Key: {plaintext key}

{"timestamp":"2026-04-17T10:00:00Z","severity":"info","message":"User signed in","user":"alice@example.com","action":"login","outcome":"success"}
{"timestamp":"2026-04-17T10:00:05Z","severity":"warn","message":"Failed MFA","user":"bob@example.com","action":"mfa","outcome":"failure"}
Headers
- X-DF-Source-Key: the plaintext ingest key for this source. This is a machine credential, separate from the Bearer JWT used for user authentication.
- Content-Type:
application/x-ndjson.
Body
Newline-delimited JSON: one complete JSON object per line, no trailing comma, no array wrapper.
Limits
- Maximum 500 events per request.
- Maximum 1 MB total body size.
- Maximum 100 KB per event raw payload.
- Message field capped at 2,000 characters.
- Host, user, and action fields capped at 200 characters.
- Tags array capped at 20 items.
- Per-source rate limit as configured on the log source record.
Envelope fields
DemandFlow recognises a small set of well-known fields and promotes them to indexed, searchable attributes on the LOG record. All are optional. If omitted, sensible defaults are applied.
timestamp(string): ISO 8601 with timezone, preferably UTC. Defaults to ingestion time if omitted.severity(string): one ofdebug,info,notice,warn,error,critical. Defaults toinfo.category(string): one ofauth,network,app,system,audit,other. Defaults toother.host(string): which machine or service produced the event.user(string): the user account associated with the event.action(string): what happened (e.g.login,config_change,file_uploaded).outcome(string): one ofsuccess,failure,unknown. Defaults tounknown.message(string): a short human-readable summary.tags(array of strings): freeform labels for categorisation and filtering.
Severity mapping guidance
Choosing the right severity makes filtering, alerting, and triage more effective:
debug: routine diagnostic data, typically high volume. Normally filtered out in day-to-day monitoring.info: normal operations. Successful logins, completed requests, scheduled jobs finishing on time.notice: noteworthy but not problematic. Configuration changes, deployments, permission changes, planned maintenance.warn: something is wrong but the system is still working. Failed login attempts, slow requests, approaching rate limits.error: something failed. 5xx responses, database timeouts, failed file uploads, unhandled exceptions.critical: requires immediate attention. Port scans, suspicious logins from blocked countries, service crashes, data integrity violations.
If your source does not provide a severity, it defaults to info. If the value is not in the allowed list, it also falls back to info.
How envelope and raw payload work together
When you POST an event, DemandFlow does two things with it:
- Envelope extraction. The well-known fields listed above are read from your event and promoted to top-level indexed attributes on the LOG record. These are the fields that appear as grid columns in the Log Viewer, the fields you can filter and search on using field-prefix syntax, and the fields that alert rules evaluate.
- Raw preservation. The entire original JSON object you sent is preserved verbatim in a field called
raw. This includes the envelope fields (they are duplicated, not moved) plus any additional fields you included. Nothing is discarded.
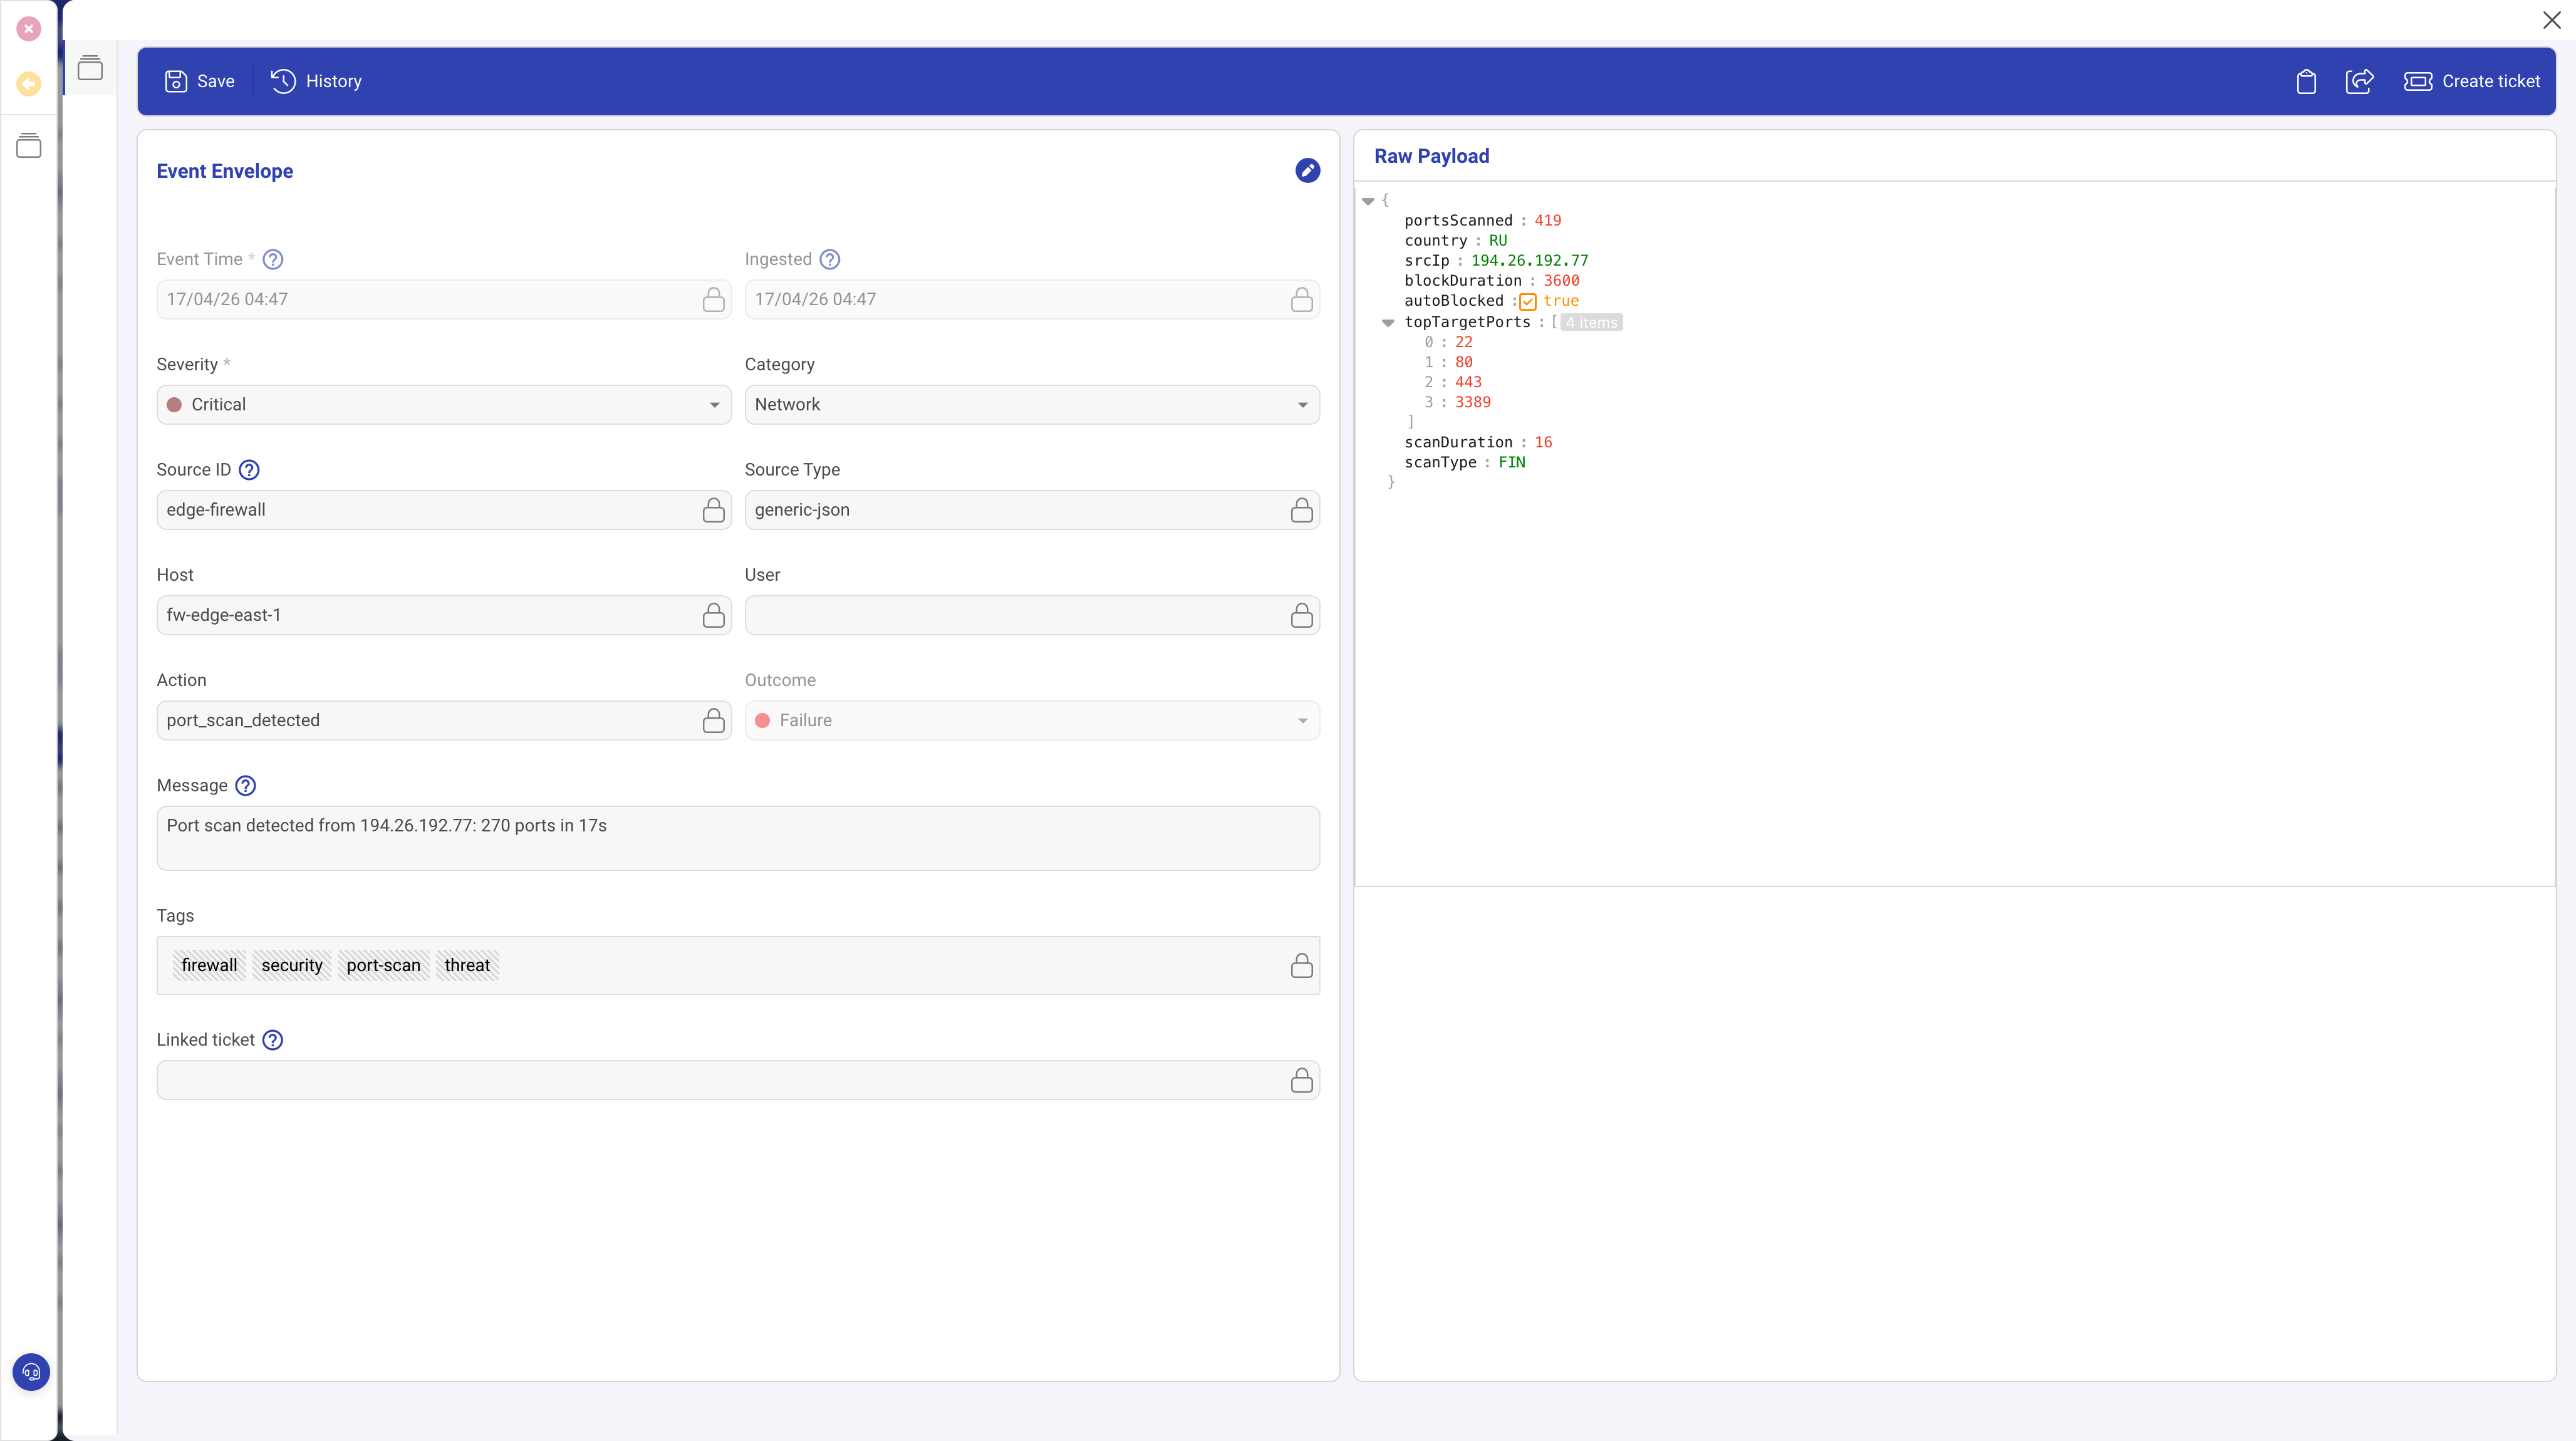
The screenshot above shows a LOG event detail. The left side displays the extracted envelope fields. The right side shows the raw payload containing the full original event, including fields like portsScanned, srcIp, and topTargetPorts that have no envelope equivalent.
Raw payload storage
The raw payload is stored as a DynamoDB Map (a native nested object), not as a JSON string. This means future capabilities such as DynamoDB filter expressions and Athena queries can read nested attributes directly without parsing.
Explicit raw field handling
If your event includes a field called raw with an object value, its contents are flattened into the stored raw payload (not nested as raw.raw). Fields in your explicit raw object take precedence on conflicts. If raw is a string value, it is stored as rawString within the raw payload.
Size limit
The raw payload is capped at 100 KB per event. Events exceeding this limit are rejected.
Structuring events for searchability
The more envelope fields you populate, the better your search and alerting experience.
Why envelope fields matter
- Alert rules can only evaluate envelope fields. If severity is missing, you cannot create severity-based alert rules.
- Field-prefix search in the Log Viewer (e.g.
host:web-01) only works on envelope fields. - Grid columns in the default Log Viewer layout are built from envelope fields.
Searching beyond the envelope
- Full-text search: a bare search term (no field prefix) scans the entire event including the raw payload.
- Raw field prefix: using
raw.prefix targets specific nested fields, for exampleraw.request.path:/api.
Custom fields
The Custom Fields feature in the Log Viewer sidebar lets you surface any nested raw field as a grid column. Design your event payloads with this in mind: use consistent field names across events from the same source so that custom columns display usable data.
Well-structured vs poorly-structured events
Good: envelope fields populated, extra detail in dedicated fields.
{"severity":"error","category":"app","action":"request_failed","outcome":"failure","host":"web-01","user":"jdoe@example.com","message":"POST /api/orders returned 500","statusCode":500,"requestId":"req_abc123","responseTimeMs":2340}Bad: everything in the message string, no structured fields.
{"message":"ERROR web-01 jdoe@example.com POST /api/orders 500 2340ms req_abc123"}The first example lets you filter by severity, search by host, create alert rules on outcome, and add statusCode or responseTimeMs as custom columns. The second requires full-text search for everything and cannot be used with alert rules or field-prefix search.
Response
- 200 OK with
{ accepted, rejected, errors }summary. - 207: some events accepted, some rejected. Check the
errorsarray. - 400: malformed body or exceeds limits.
- 401: missing, invalid, or revoked key.
- 429: rate limit exceeded. Back off and retry.
Example: curl
curl -X POST "$INGEST_URL" \
  -H "X-DF-Source-Key: $INGEST_KEY" \
  -H "Content-Type: application/x-ndjson" \
  --data-binary '{"timestamp":"2026-04-17T10:00:00Z","severity":"info","message":"hello from curl","action":"test","outcome":"success"}'
Example: Node.js
const events = [
  { timestamp: new Date().toISOString(), severity: 'info', message: 'User signed in', user: 'alice@example.com', action: 'login', outcome: 'success' },
  { timestamp: new Date().toISOString(), severity: 'warn', message: 'Failed MFA', user: 'bob@example.com', action: 'mfa', outcome: 'failure' },
];
const body = events.map(e => JSON.stringify(e)).join('\n');

const res = await fetch(process.env.INGEST_URL, {
  method: 'POST',
  headers: {
    'X-DF-Source-Key': process.env.INGEST_KEY,
    'Content-Type': 'application/x-ndjson',
  },
  body,
});
console.log(res.status, await res.json());
Batching and retry
- Buffer events in memory for up to a few seconds, then flush.
- Cap each batch at 500 events or approximately 800 KB, whichever is smaller.
- On 429, back off exponentially and retry the same batch.
- On 207, read the
errorsarray to identify which specific events failed. Most rejections are due to malformed JSON or oversized raw payloads and will fail again on retry. - On 5xx, retry up to three times with jitter, then spool to local disk or a queue so you do not lose events.
Monitoring that events are arriving
After the first events land, open the log source record. The Last Used field updates as events flow in. The Source Health screen shows event counts, status, and trend sparklines for all sources at a glance.
What to do next
Once events are flowing, see Using the Log Viewer to search, filter, and analyse your log data. To turn events into automatic alerts, see Writing alert rules.