Opening the Log Viewer
Navigate to SIEM > Logs in the sidebar. This opens the Log Viewer, the primary screen for browsing, searching, and analysing ingested log events across all your configured sources.
Screen Layout
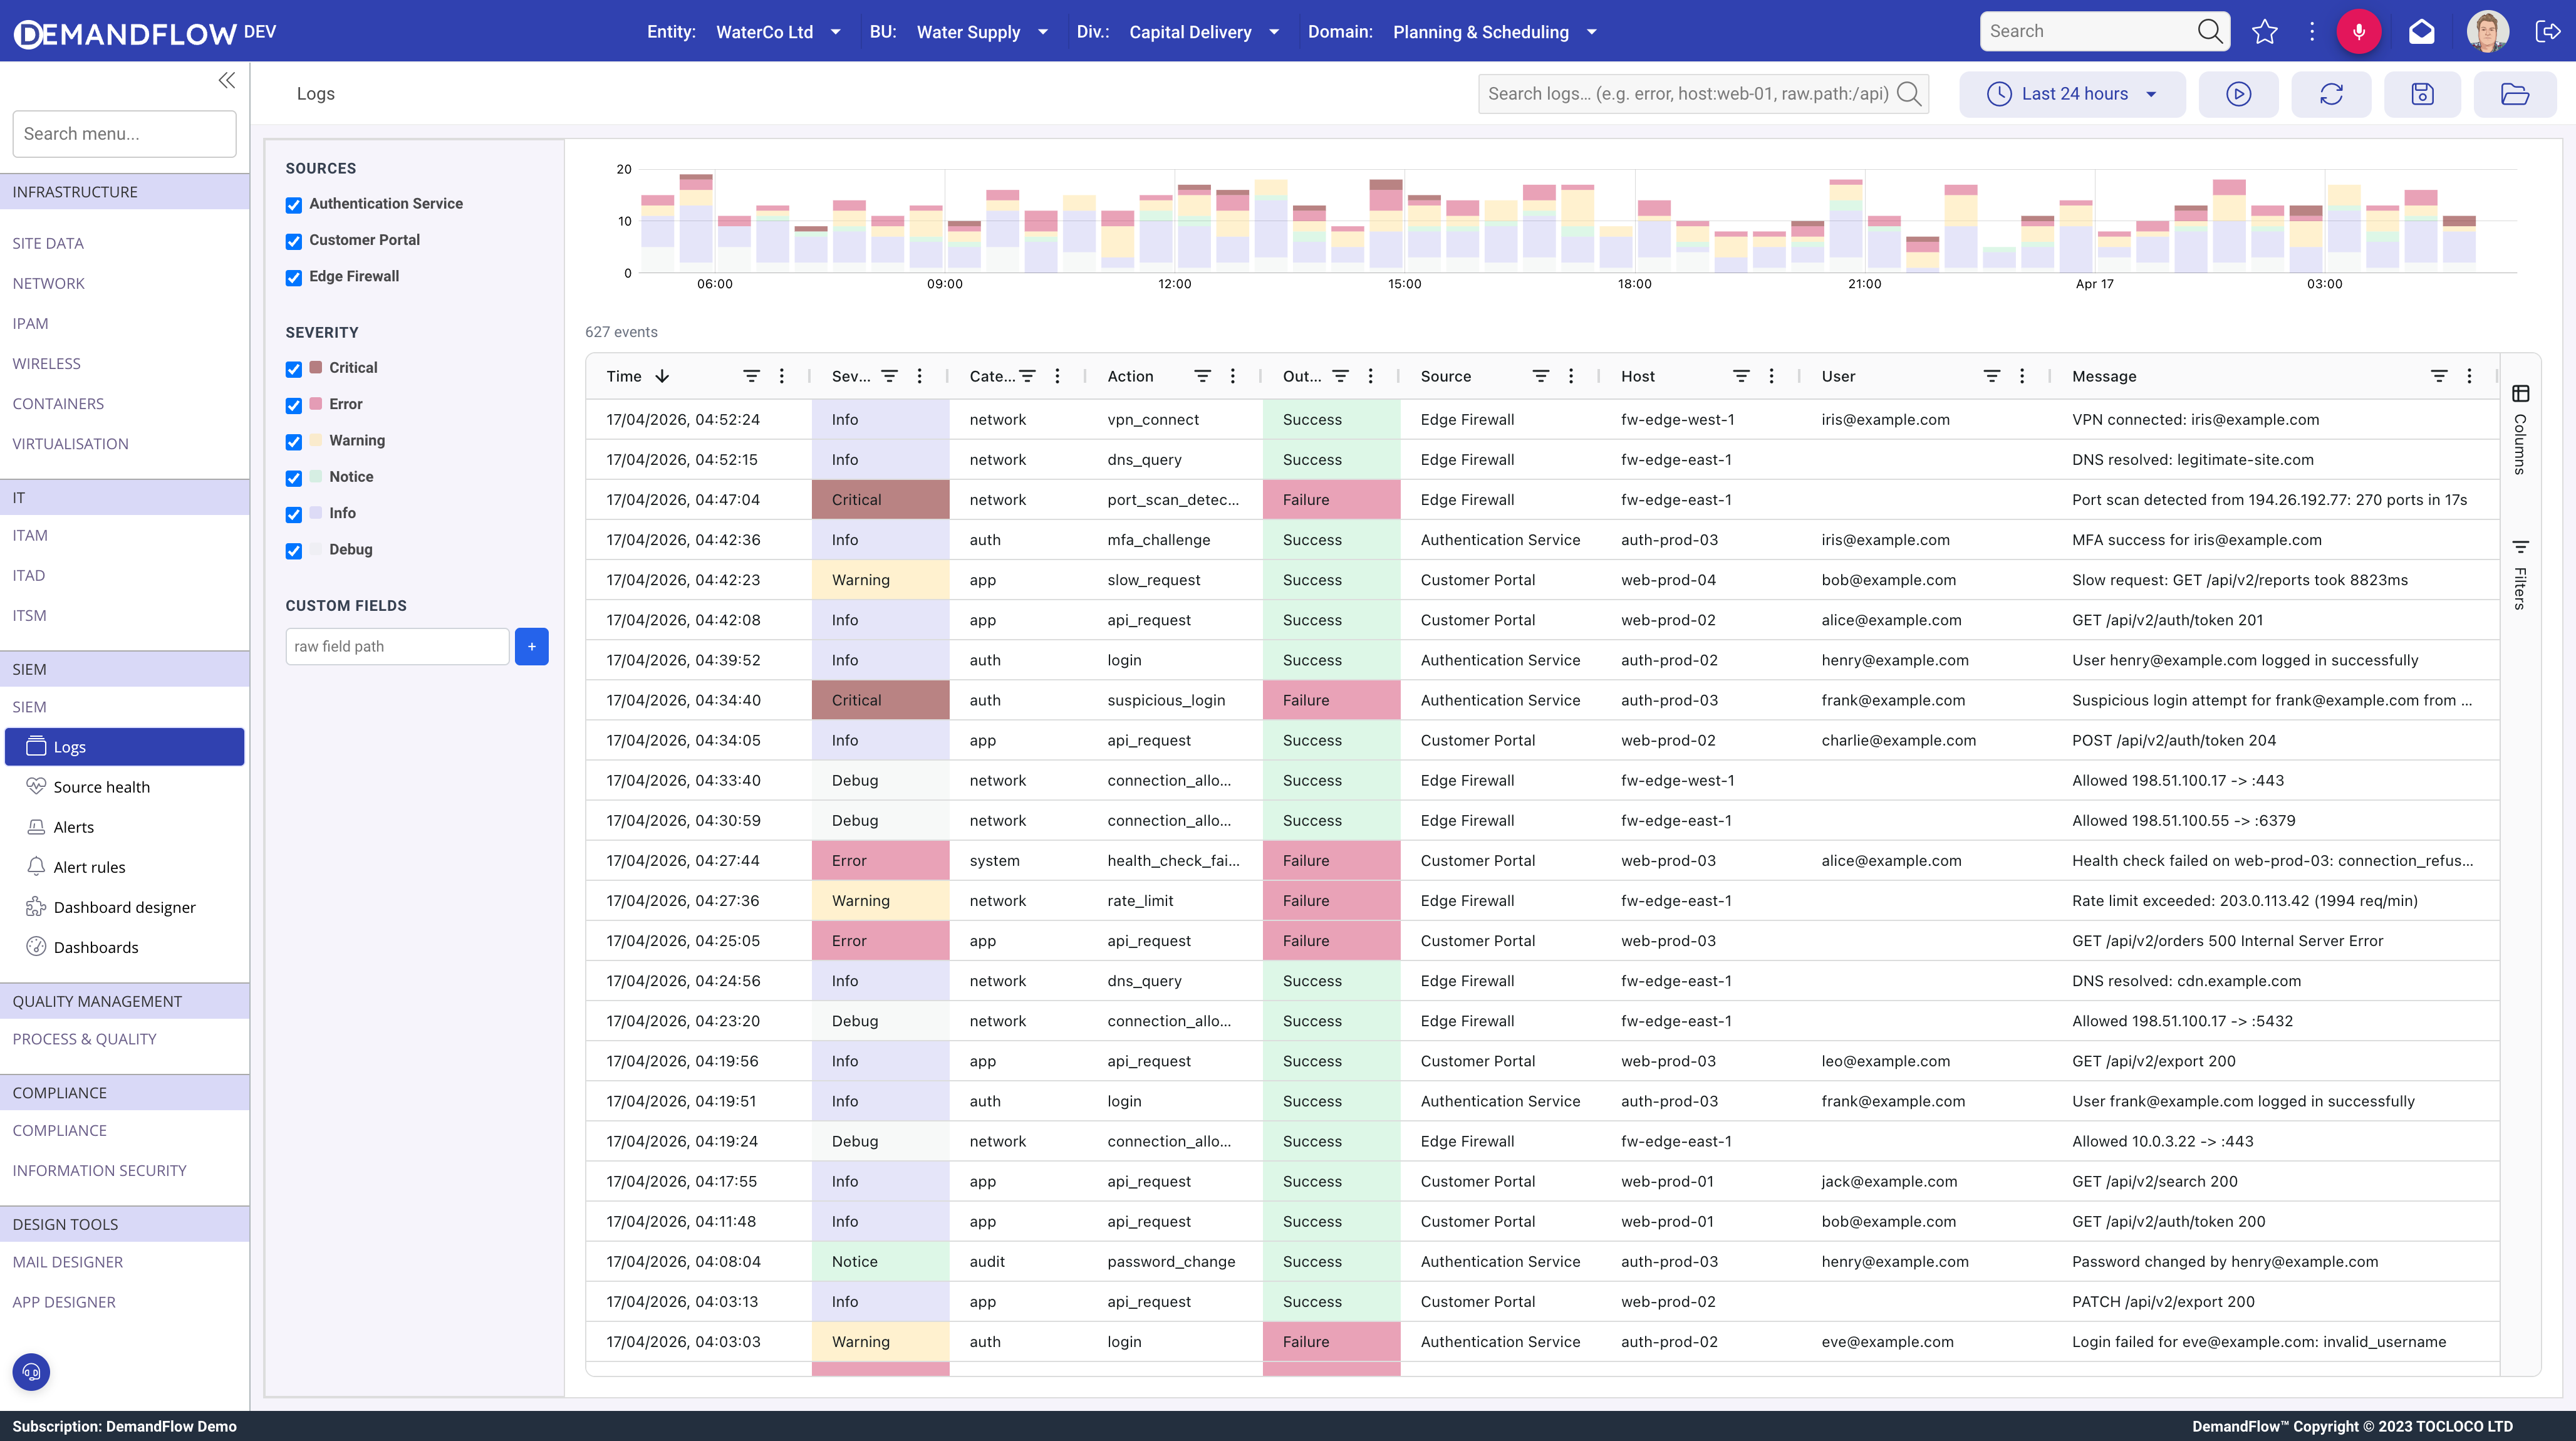
The Log Viewer is divided into three areas:
- Left sidebar contains the facet panels (Sources, Severity) and the Custom Fields section.
- Top right shows the histogram, a stacked column chart of events over time coloured by severity.
- Bottom right shows the count row (total events, search chip, zoom chip) and the grid with one row per log event.
The toolbar at the top of the screen provides the time range selector, search bar, live refresh controls, and saved view buttons.
Time Range Selector
The toolbar contains preset time range buttons: 15 minutes, 1 hour, 24 hours, and 7 days. Clicking a preset fetches events for that window ending at the current time. Narrower ranges fetch less data and load faster. The selected range also controls the histogram bucket size:
- 15 minutes uses 15-second buckets
- 1 hour uses 1-minute buckets
- 24 hours uses 30-minute buckets
- 7 days uses 6-hour buckets
Changing the time range triggers a fresh server query. Any active histogram zoom is cleared.
Facet Sidebar: Sources
The Sources panel lists every LOGSOURCE configured for your subscription, each with a checkbox. Checked sources are included in the server query. Unchecked sources are excluded entirely.
This is a server-side control. When you uncheck a source, the next data fetch skips that source completely. This reduces the amount of data queried from DynamoDB, which improves load time and lowers read costs. If you are investigating an issue on a specific host or application, uncheck the sources you do not need.
Facet Sidebar: Severity
The Severity panel lists the severity levels from Critical down to Debug, each with a checkbox. These control client-side filtering only. All events for the selected sources and time range have already been fetched. Toggling a severity checkbox immediately shows or hides matching rows in the grid and redraws the histogram, with no additional server request.
This makes severity filtering instant. You can rapidly toggle between viewing only Critical and Error events, then switch to showing everything, without waiting for data to reload.
Understanding the Difference: Source vs. Severity Facets
This distinction matters for performance:
- Source facets change what data is fetched from the server. Unchecking a source means fewer DynamoDB reads and less data transferred. Use source facets to control how much data you load.
- Severity facets filter data that is already loaded in the browser. They have no impact on server load or fetch time. Use severity facets to focus your view without re-querying.
Full-Text Search
The search bar in the toolbar accepts free-text queries. Search is server-side. The Lambda applies the search filter during the DynamoDB read, scanning items and returning only those that match.
Search Syntax
Three search syntaxes are supported:
- Bare term. Type a word or phrase such as
errororlogin failed. This searches the entire event, including all envelope fields and the full raw payload, case-insensitively. - Field prefix. Use
field:valuesyntax to search a specific envelope field. For example,host:web-01matches only events where the host field contains "web-01". - Nested raw field. Use
raw.path.to.field:valueto search inside the raw payload. For example,raw.request.path:/apimatches events where the raw payload has arequest.pathvalue containing "/api".
Search Behaviour
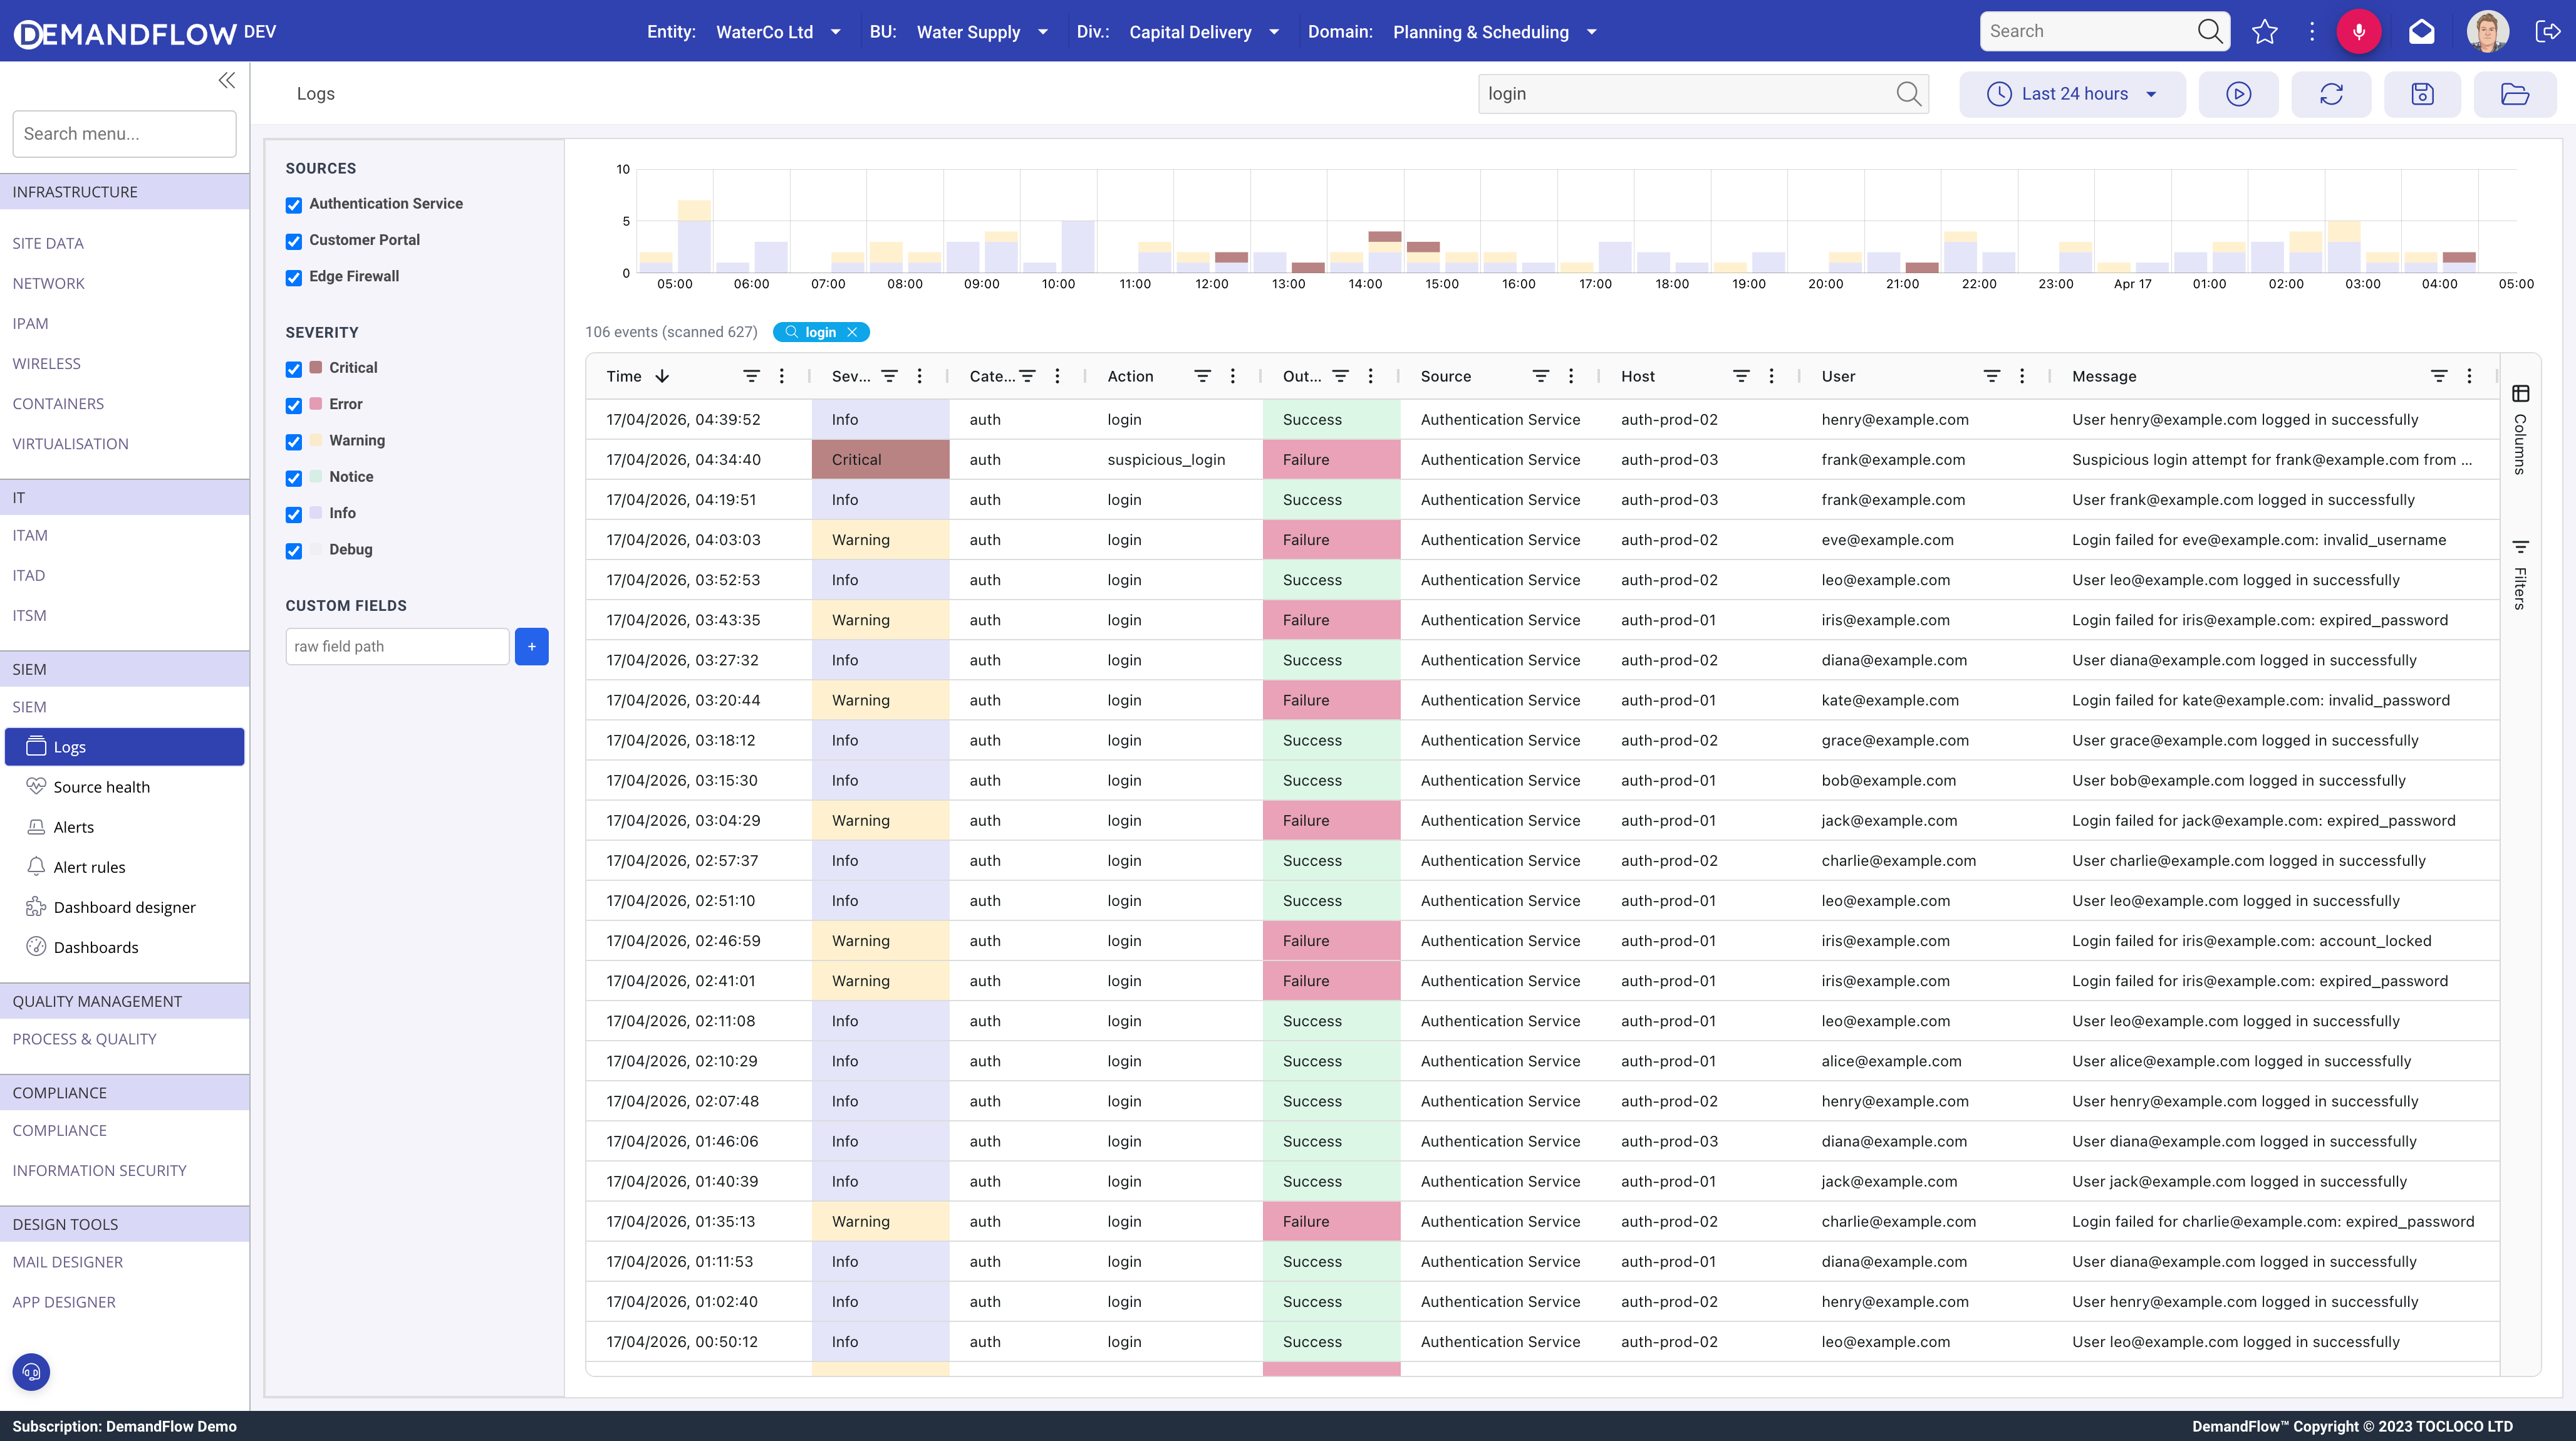
- Search has a 700ms debounce. After you stop typing, the query fires automatically.
- When a search is active, a search chip appears in the count row showing your search term. Click the chip to clear the search and reload unfiltered data.
- The count row shows a "scanned X" indicator. This tells you how many items the Lambda read from DynamoDB to find your matches. A high scanned count relative to the result count means the search term is rare in the data set.
Histogram
The histogram is a stacked column chart where each column represents a time bucket and the colour segments represent severity levels. Hover over a column to see a tooltip with the count per severity for that bucket.
The histogram updates when you change the time range, toggle source facets, run a search, or toggle severity facets.
Histogram Brush Zoom
Click and drag across the histogram to select a time window. This applies a client-side filter to the grid, showing only events within the selected window. No data is re-fetched from the server.
When a zoom is active, a blue "Zoom" chip appears in the count row showing the selected time window. To clear the zoom, either click the Zoom chip or click anywhere on the histogram without dragging.
This is useful for drilling into a spike. Select the 24-hour range to see the full picture, spot an anomaly in the histogram, then drag across it to isolate the events in that period.
Event Grid
The grid displays one row per log event. The default visible columns are:
- Time (event timestamp, sorted newest first by default)
- Severity (colour-coded cell background)
- Category
- Action
- Outcome (colour-coded: green for Success, red for Failure, grey for Unknown)
- Source (displays the source display name, not the slug)
- Host
- User
- Message
Two additional columns are available but hidden by default: Event ID (useful when correlating with alert sample event IDs) and Ticket (shows the linked ticket reference if one exists).
Column Filters
Every column has a built-in grid filter accessible via the funnel icon in the column header. These are client-side filters that narrow the visible rows without re-querying the server. For a full view of all active column filters, open the Filters tab on the right edge of the grid.
Columns Panel
The Columns tab on the right edge of the grid lets you show, hide, and reorder columns. Drag columns to rearrange them, or use the checkboxes to toggle visibility.
Custom Fields
The sidebar has a Custom Fields section below the facet panels. This lets you promote values from the raw payload into dedicated grid columns.
Type a dotted path into the input field and click the + button. For example:
errorCodeadds a column readingraw.errorCodefrom each eventmetadata.userIdadds a column readingraw.metadata.userIdstatusCodeadds a column readingraw.statusCoderequest.pathadds a column readingraw.request.path
Each custom field appears as a new column in the grid with the path as its header. Remove it with the minus button next to the field name in the sidebar.
Custom fields are session-only by default. They are cleared when you navigate away or refresh the page. To persist them, save a view (see Saved Views below).
Event Detail
Click any row in the grid to open the LOG event detail in a popout panel.
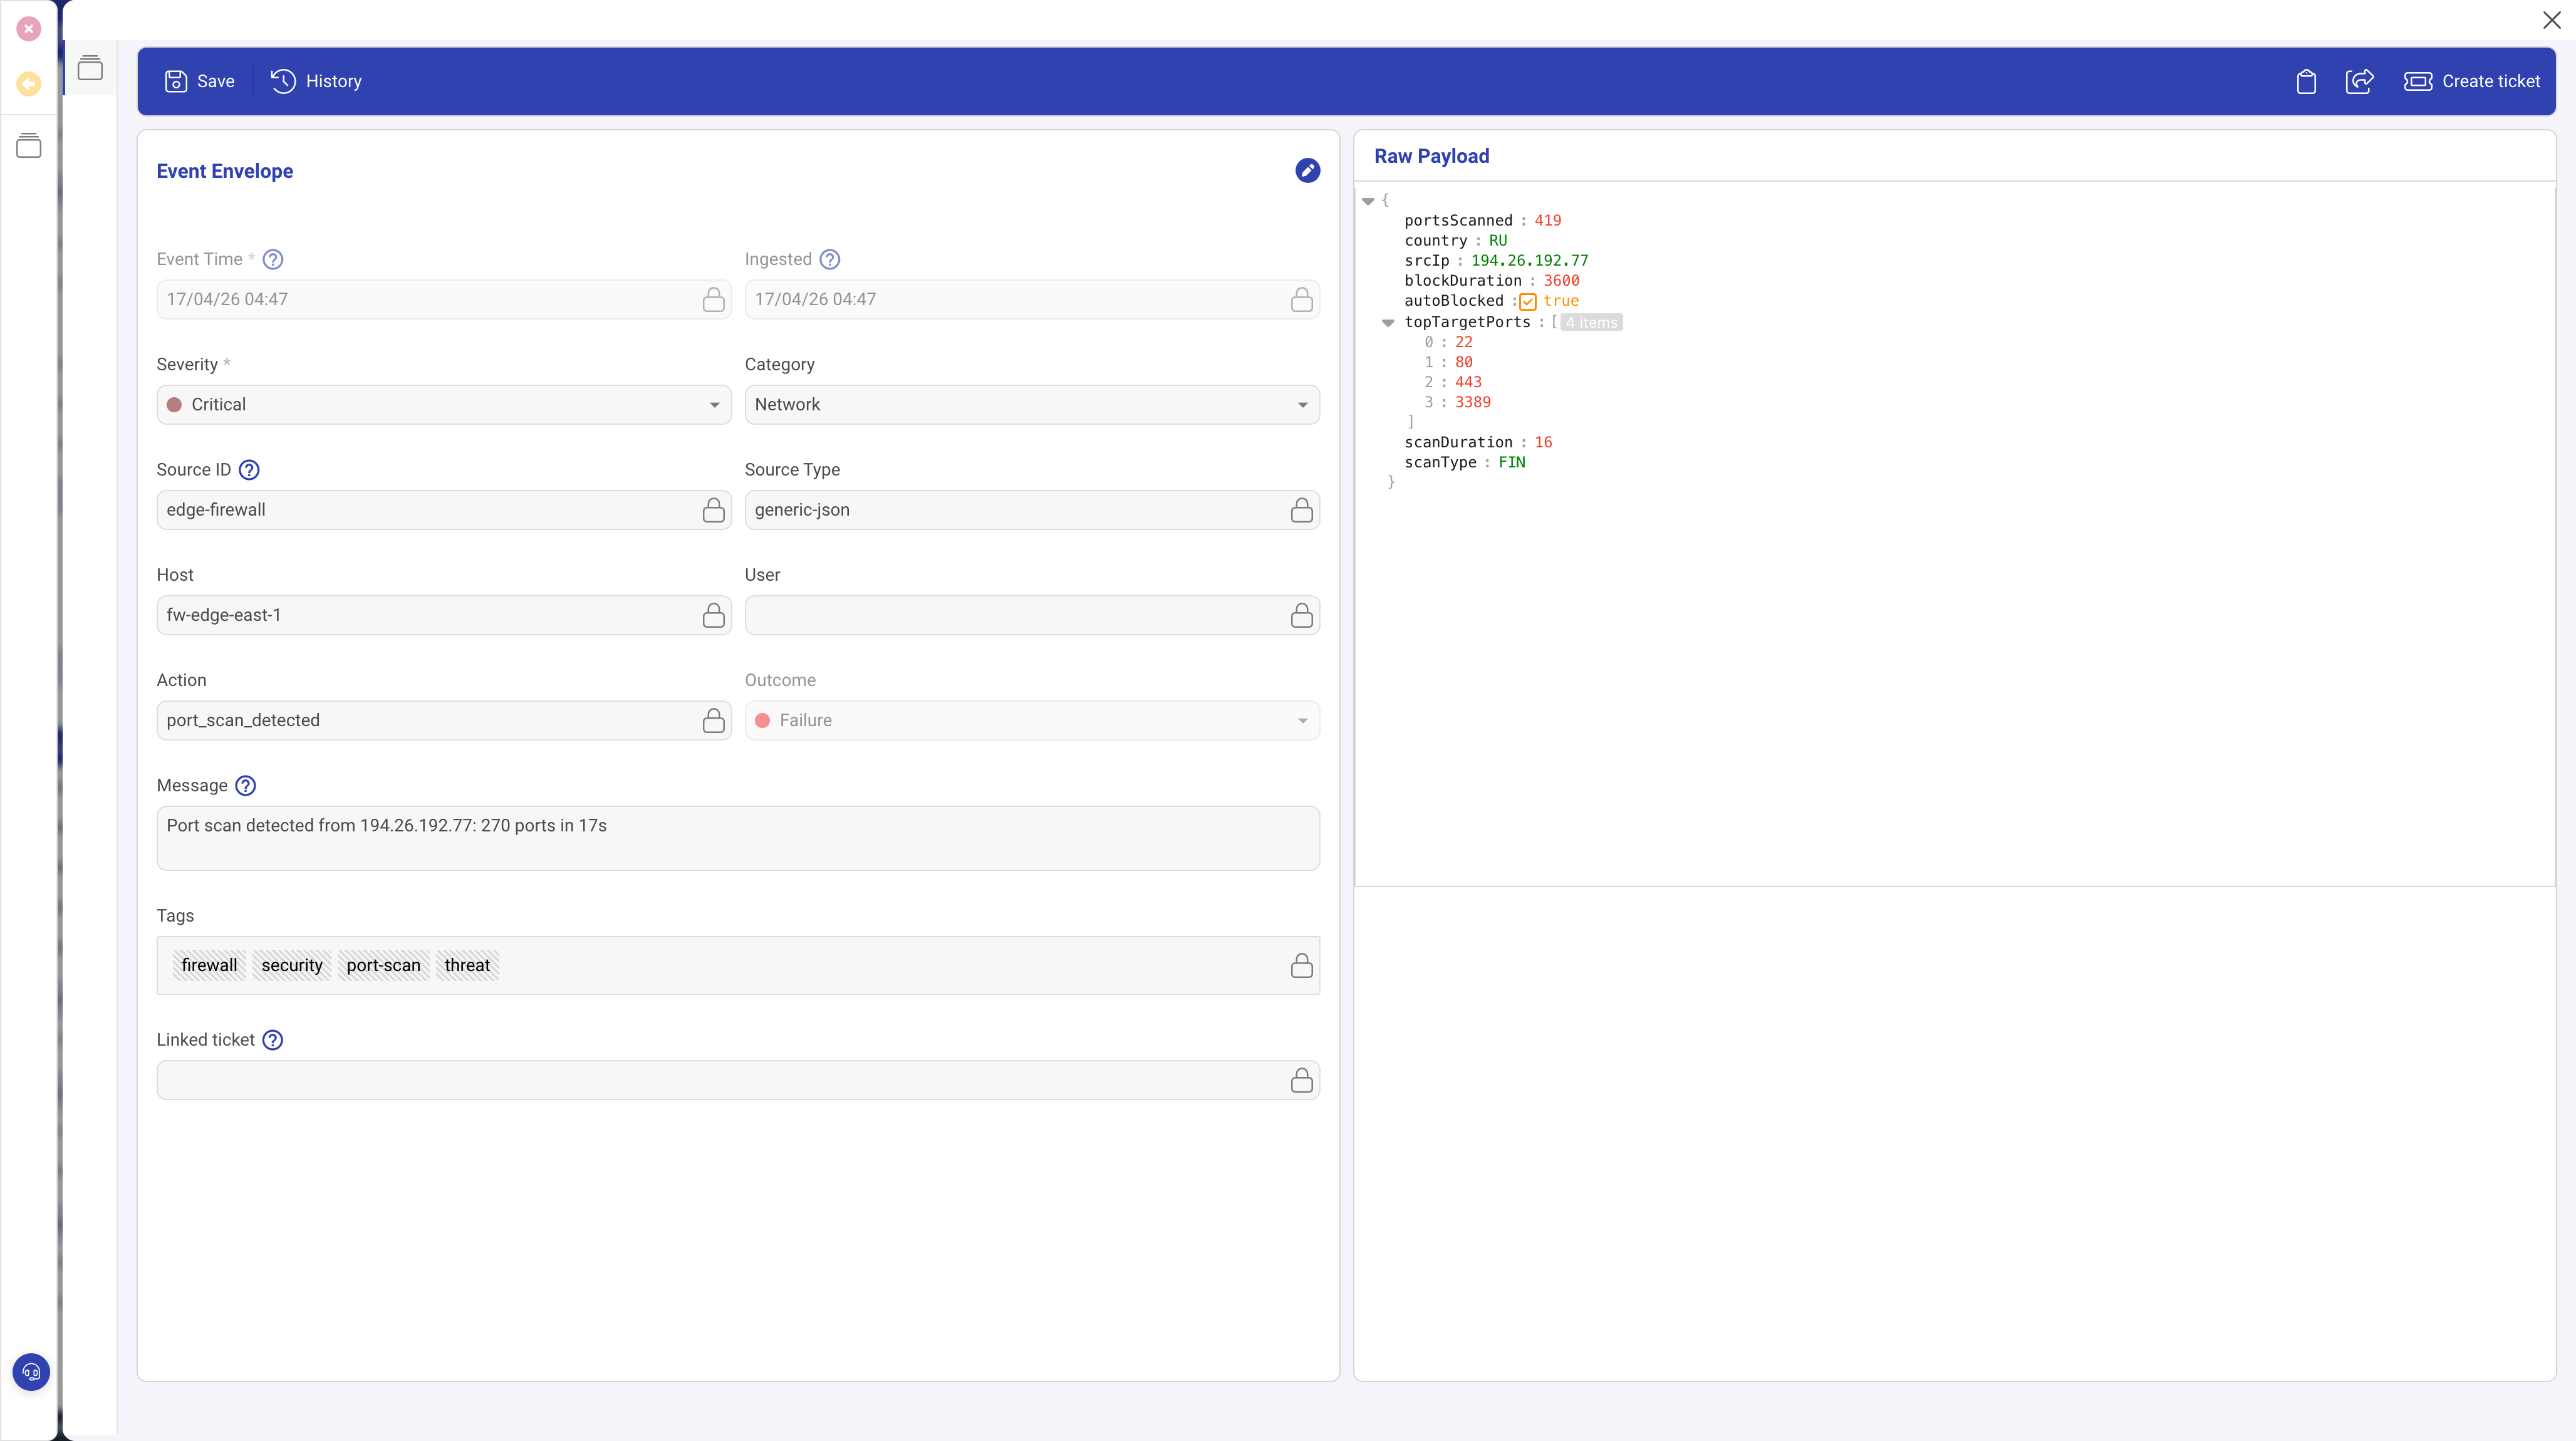
The detail view has two sections:
- Left side: Event Envelope. The normalised fields that DemandFlow extracts from every event: timestamp, ingested time, severity, category, source ID, source type, host, user, action, outcome, message, tags, and linked ticket.
- Right side: Raw Payload. The original event exactly as the source sent it, preserved verbatim and displayed in a collapsible JSON viewer. Every field the source included is present here, including fields that have no envelope equivalent.
The toolbar in the detail view includes a Create ticket button for raising a support ticket directly from the event.
Live Refresh
The play button in the toolbar starts automatic polling. When activated, an interval selector appears with the following options:
- 5 seconds
- 15 seconds
- 30 seconds
- 1 minute (default)
- 5 minutes
- 15 minutes
While live refresh is active, the Log Viewer re-fetches data at the chosen interval using the current time range, source selection, and search term. The histogram, count, and grid update with each refresh.
Safeguards:
- If the previous fetch is still in flight, the next poll is skipped to avoid overlapping requests.
- Live refresh stops automatically if you navigate away from the Logs screen.
- Click the stop button to manually stop polling.
Saved Views
Saved views let you store and recall a complete Log Viewer configuration. Views are per-user.
A saved view captures:
- Time range
- Selected sources
- Selected severities
- Custom fields
- Search term
- Live refresh configuration (interval and on/off state)
- Grid state: column order, column widths, sort order, column visibility, and active filter model
Saving
Click the floppy disk icon in the toolbar. If you already have a view loaded, you can overwrite it with Save or use Save as new to create a separate copy.
Loading
Click the folder icon to open the load popout. Click a saved view to apply it. The entire Log Viewer state is restored, including grid layout and any custom fields.
Deleting
In the load popout, each view has a delete button. Deleted views cannot be recovered.
Exporting Data
JSON Export
Right-click any row in the grid and select Export > JSON Export. This exports all currently visible rows (after all active filters including severity facets, histogram zoom, column filters, and search) as NDJSON (newline-delimited JSON). Each line is a complete event object including the full raw payload. The file is named with a timestamp, for example demandflow-logs-2026-04-17-09-30-00.ndjson.
CSV and Excel Export
CSV and Excel export options are also available in the right-click Export submenu. These export the visible grid columns but do not include the raw payload, since nested JSON cannot be represented in flat tabular formats.
Creating a Ticket from an Event
Right-click a row in the grid to see context menu actions:
- Create ticket from this event opens a new ticket linked to the log event.
- If the event already has a linked ticket, the option changes to Open linked ticket: {REF}, which navigates directly to the existing ticket record.
Count Row
The count row sits between the histogram and the grid. It displays:
- Event count: the total number of visible events, for example "617 events".
- Data cap warning: if the fetch hit the per-source cap of 1,000 events, the count row shows "data fetch capped at 1000 per source". Narrow the time range or add a search term to work around the cap.
- Search chip: when a search is active, a removable chip displays the search term. The "scanned X" number next to it shows how many items the Lambda read from DynamoDB.
- Zoom chip: when a histogram brush zoom is active, a blue removable chip shows the selected time window.
Performance Tips
- Narrow the time range. The biggest factor in load time is the time range. Use 15 minutes or 1 hour when investigating a recent issue. Reserve 7 days for trend analysis.
- Use source facets to limit the query. Each checked source is a separate server query. If you only need firewall logs, uncheck everything else.
- Use severity facets for quick filtering. Because severity filtering is client-side, toggling severities is instant and free. Use this to focus on Critical and Error events without re-querying.
- Use search for targeted lookups. When you need a specific IP address, username, or error message across a large data set, search is more efficient than loading everything and using column filters.
- Use histogram zoom to narrow further. After loading a broad time range, drag across a spike in the histogram to isolate the relevant period without a round trip to the server.