Why source health matters
When a log source stops sending events, it does not generate an error on the Logs screen. It simply goes quiet. There are no failed entries to investigate because nothing is arriving. An agent crash, a network break, a revoked ingest key, or an attacker deliberately silencing logging all produce the same outcome: silence.
This makes silent sources one of the most dangerous conditions in any SIEM deployment. You cannot search for events that were never ingested. The only way to detect the problem is to notice the absence of expected activity.
The Source Health screen gives you a dedicated view for exactly this purpose.
Opening the screen
Navigate to SIEM > Source health in the sidebar.
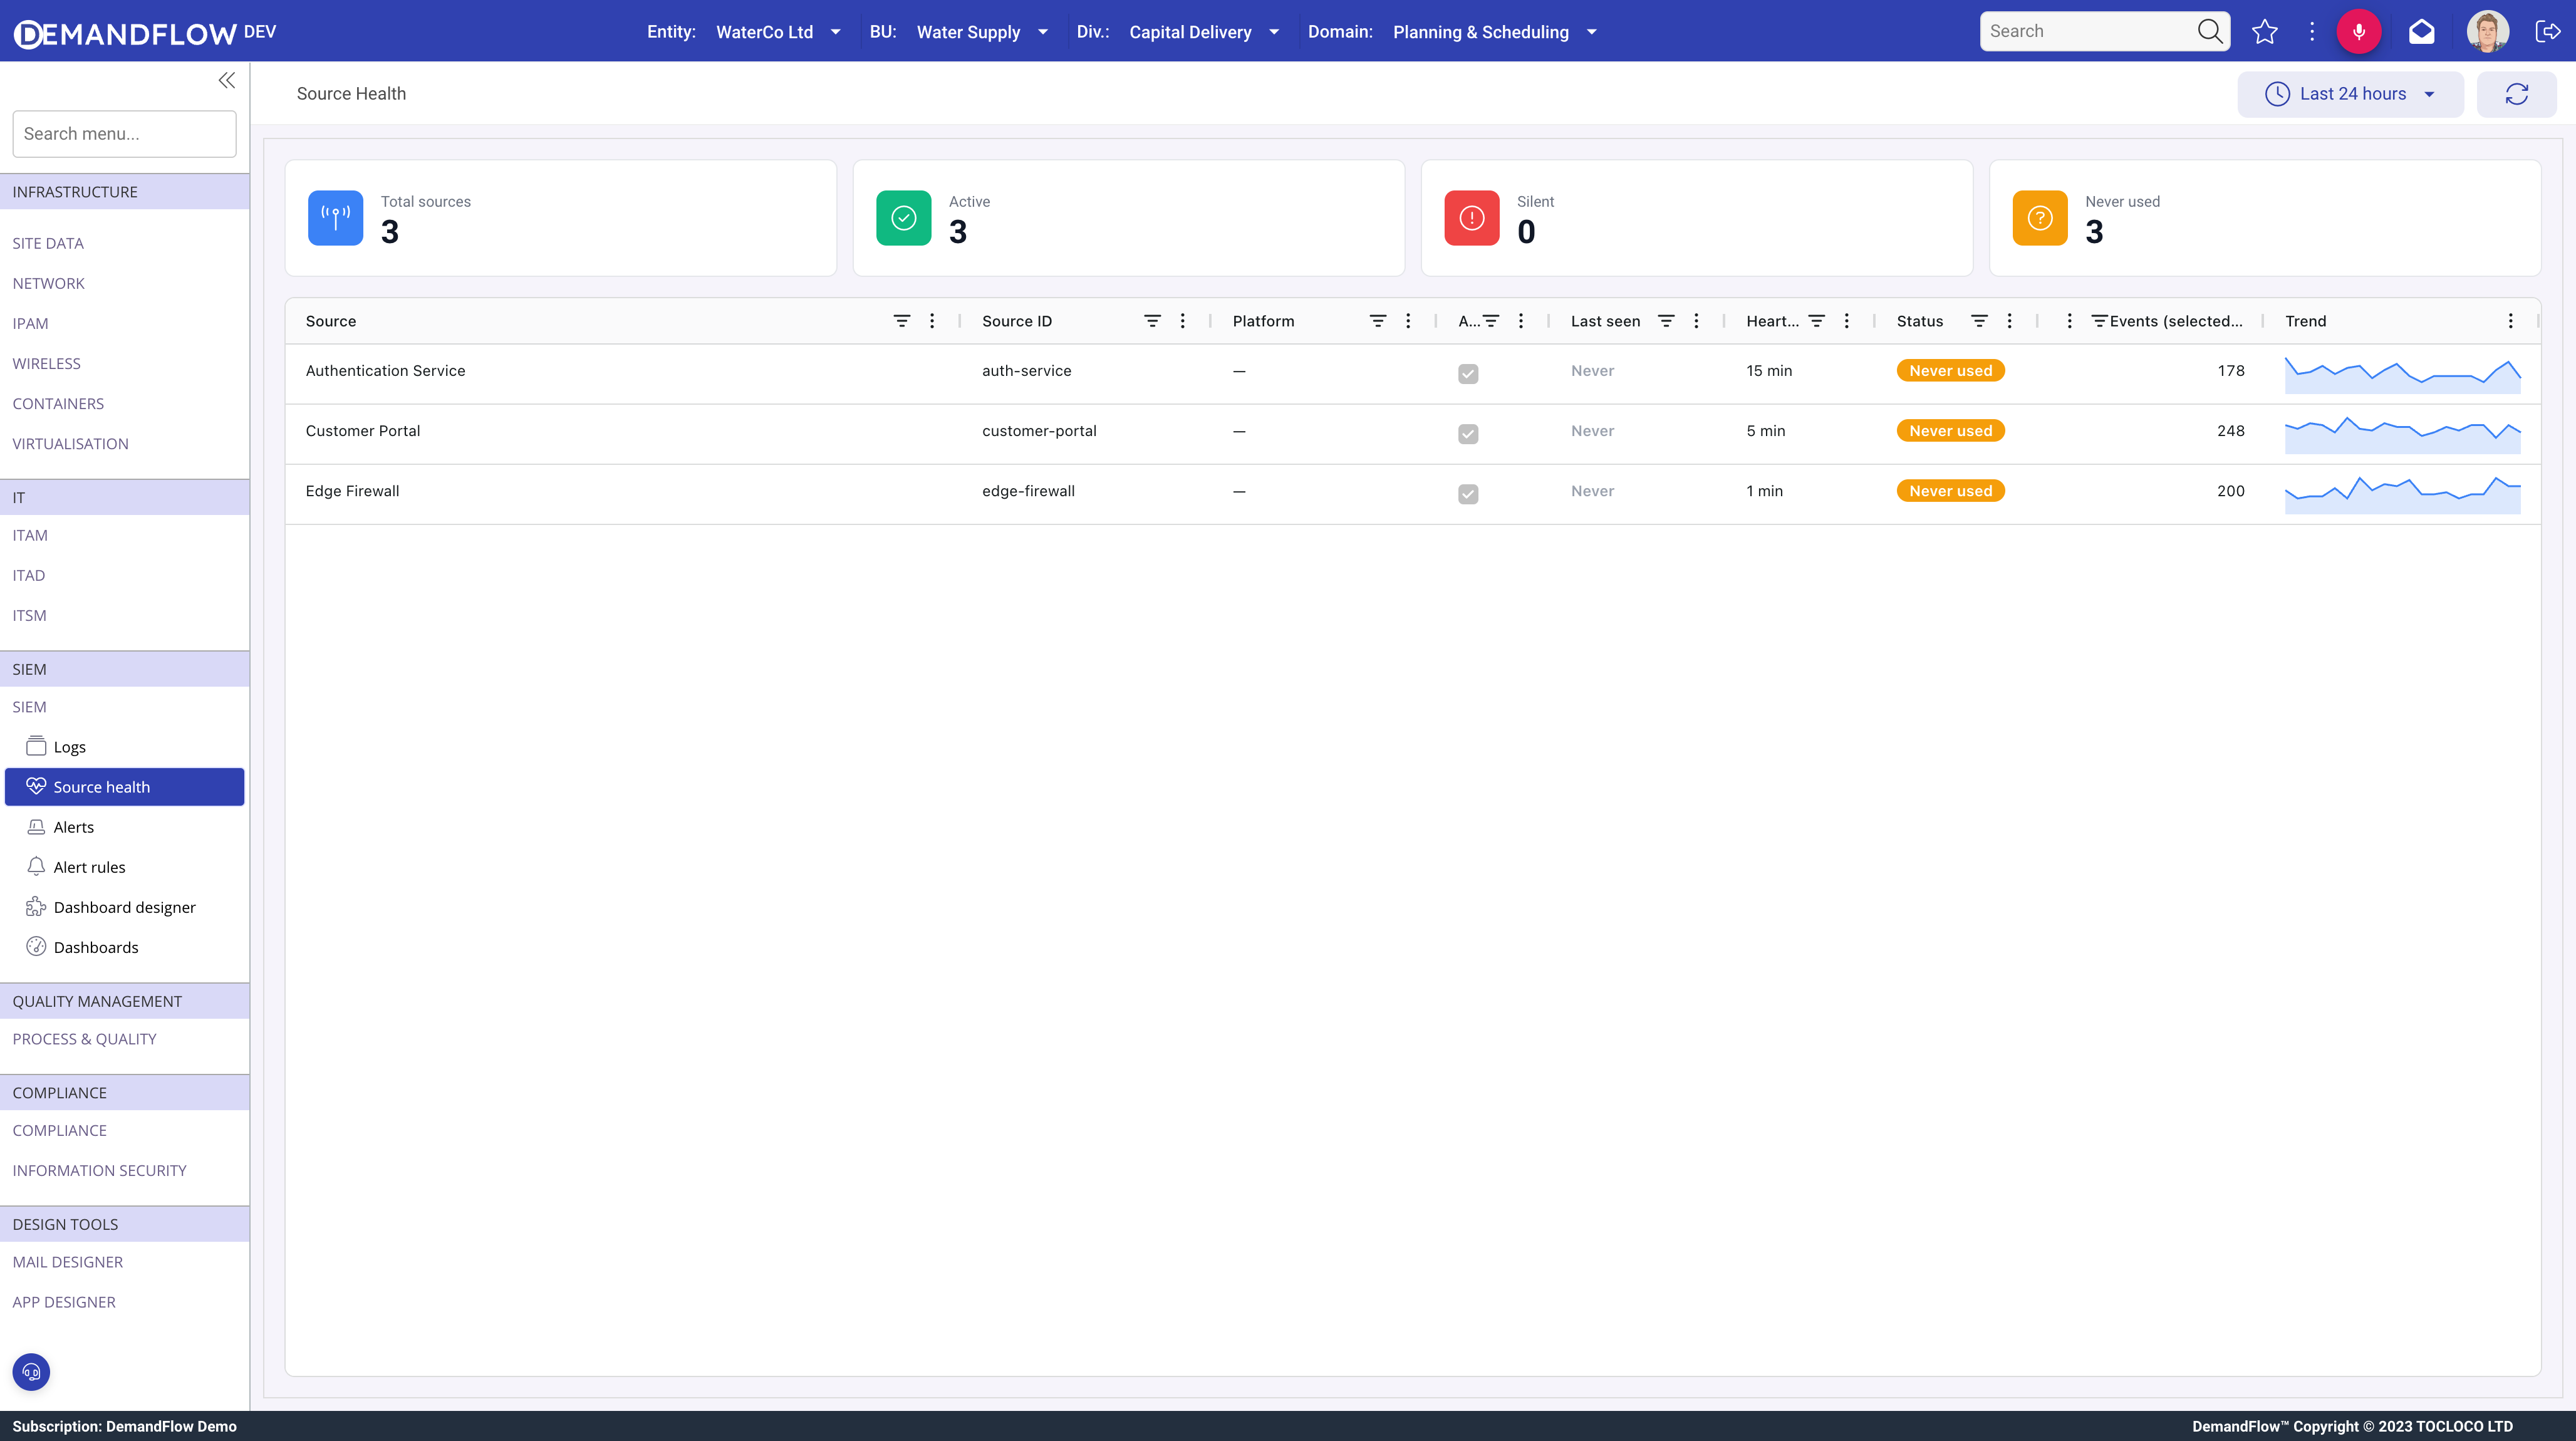
Summary cards
Four cards at the top of the screen give you an immediate overview of your source estate.
- Total sources: the total count of all LOGSOURCE records in your subscription.
- Active: sources where the Active flag is set to Yes. These are the sources you expect to be sending events.
- Silent: active sources whose last event arrival exceeds their configured heartbeat interval. This is the danger zone. These sources should be sending events but have gone quiet beyond their acceptable threshold.
- Never used: sources that have never received any events. Common after initial setup before the source agent has been wired up.
The grid
Below the summary cards, a grid displays one row per LOGSOURCE with the following columns:
- Source: the display name of the log source.
- Source ID: the immutable slug identifier assigned when the first ingest key was generated.
- Platform: the linked platform, if one has been associated with the source.
- Active: whether the source is enabled (Yes) or manually disabled (No).
- Last seen: a relative timestamp (for example, "5m ago", "3h ago"). Colour-coded: green if recent, amber if stale, red if long silent.
- Heartbeat (mins): the expected maximum interval between events, from the LOGSOURCE record. 0 means heartbeat monitoring is disabled.
- Status: a pill badge: Healthy (green), Silent (red), Inactive (grey), or Never used (amber).
- Events (selected range): the event count for the time range chosen in the toolbar.
- Trend: a sparkline showing event volume over the selected time range.
Time range selector
The toolbar includes three options: 1 hour, 24 hours, and 7 days. Changing the time range updates both the Events column counts and the Trend sparklines.
Use 1 hour for real-time monitoring during an incident. Use 24 hours for a daily check. Use 7 days for a broader view of source behaviour over the past week.
Clicking a row
Clicking any row opens the LOGSOURCE detail view for that source. From there you can inspect the configuration, check the ingest key, rotate the key if needed, review heartbeat settings, or jump to recent events.
Health status logic
The status pill for each source is derived using the following rules, evaluated in order:
- Inactive: the Active flag is set to No. The source has been manually disabled.
- Never used: the lastUsedAt field is empty. The source has never received events.
- Silent: the source is active, heartbeatIntervalMinutes is greater than 0, and the time elapsed since lastUsedAt exceeds heartbeatIntervalMinutes.
- Healthy: the source is active and either the heartbeat is 0 (monitoring disabled) or lastUsedAt is within the heartbeat window.
Heartbeat configuration
The heartbeatIntervalMinutes field on the LOGSOURCE record controls how long the system waits before flagging a source as Silent.
Set this to the maximum acceptable gap for the source. A source that sends events every minute should have a heartbeat of perhaps 5 to 10 minutes, allowing for normal variance without false alarms. A source that sends hourly might use a heartbeat of 90 minutes.
Setting heartbeatIntervalMinutes to 0 disables heartbeat monitoring entirely. The source will always show as Healthy (if active), regardless of when it last sent events. Use this for sources with sporadic or on-demand sending patterns, such as batch jobs that run on a schedule.
What to do when a source is silent
When the Source Health screen shows a source in Silent status, work through the following steps:
- Check the source system itself. Has the agent or forwarder process crashed? Is the service still running?
- Check the ingest key. Has it been revoked or rotated without updating the source configuration?
- Check network connectivity. Can the source reach the ingest endpoint? Look for firewall changes, DNS failures, or proxy misconfigurations.
- Check the source's own logs. Look for POST failures, HTTP 401 (authentication rejected), or HTTP 429 (rate limited) responses.
- Check the Last seen column. The timestamp tells you exactly when events last arrived, helping narrow the window of investigation.
Automating silent source detection
Checking the Source Health screen manually is important, but you should not rely on it as the sole detection method for critical sources. Absence alert rules can be configured to fire automatically when a source goes quiet. This means operators receive a notification rather than discovering the problem during a periodic review.
Absence rules are covered in detail in the Writing alert rules article. The key benefit is that the system watches continuously, even when no one is looking at the Source Health screen.
Tips
- Sort by Last seen to push the quietest sources to the top of the grid.
- Review weekly as part of your operational routine, even if you have Absence alert rules in place.
- Use Absence rules for critical sources. Any source where silence could indicate a security incident or compliance gap should have an automated alert.
- Set heartbeat to 0 for sporadic sources. Sources that send events on demand (batch jobs, manual exports) should have heartbeat monitoring disabled so they do not appear as Silent between runs.
- Watch the Trend sparklines. A source that drops from 10,000 events per day to 2,000 is not yet silent, but it may indicate a problem developing. Catching this early is easier than diagnosing a fully silent source.