Dependencies capture directional relationships between deployed platform instances. They answer the question: if this platform goes down, what else breaks?
Dependency records
Each dependency links a source platform (the one that has the dependency) to a target platform (the one being depended on). For example: if IMS depends on Network Cloud, the source is IMS and the target is Network Cloud.
- Relationship Type: Depends On, Component Of, or Integrates With.
- Criticality: Low, Medium, High, or Critical (colour-coded).
- Description: the nature of the dependency and what breaks if the target is unavailable.
- Mitigations: fallback or redundancy measures in place.
Bidirectional views
On each platform instance, the Dependencies panel shows two related lists side by side:
- Depends On (left): platforms this instance relies on.
- Depended On By (right): platforms that rely on this instance.
The Dependency Map
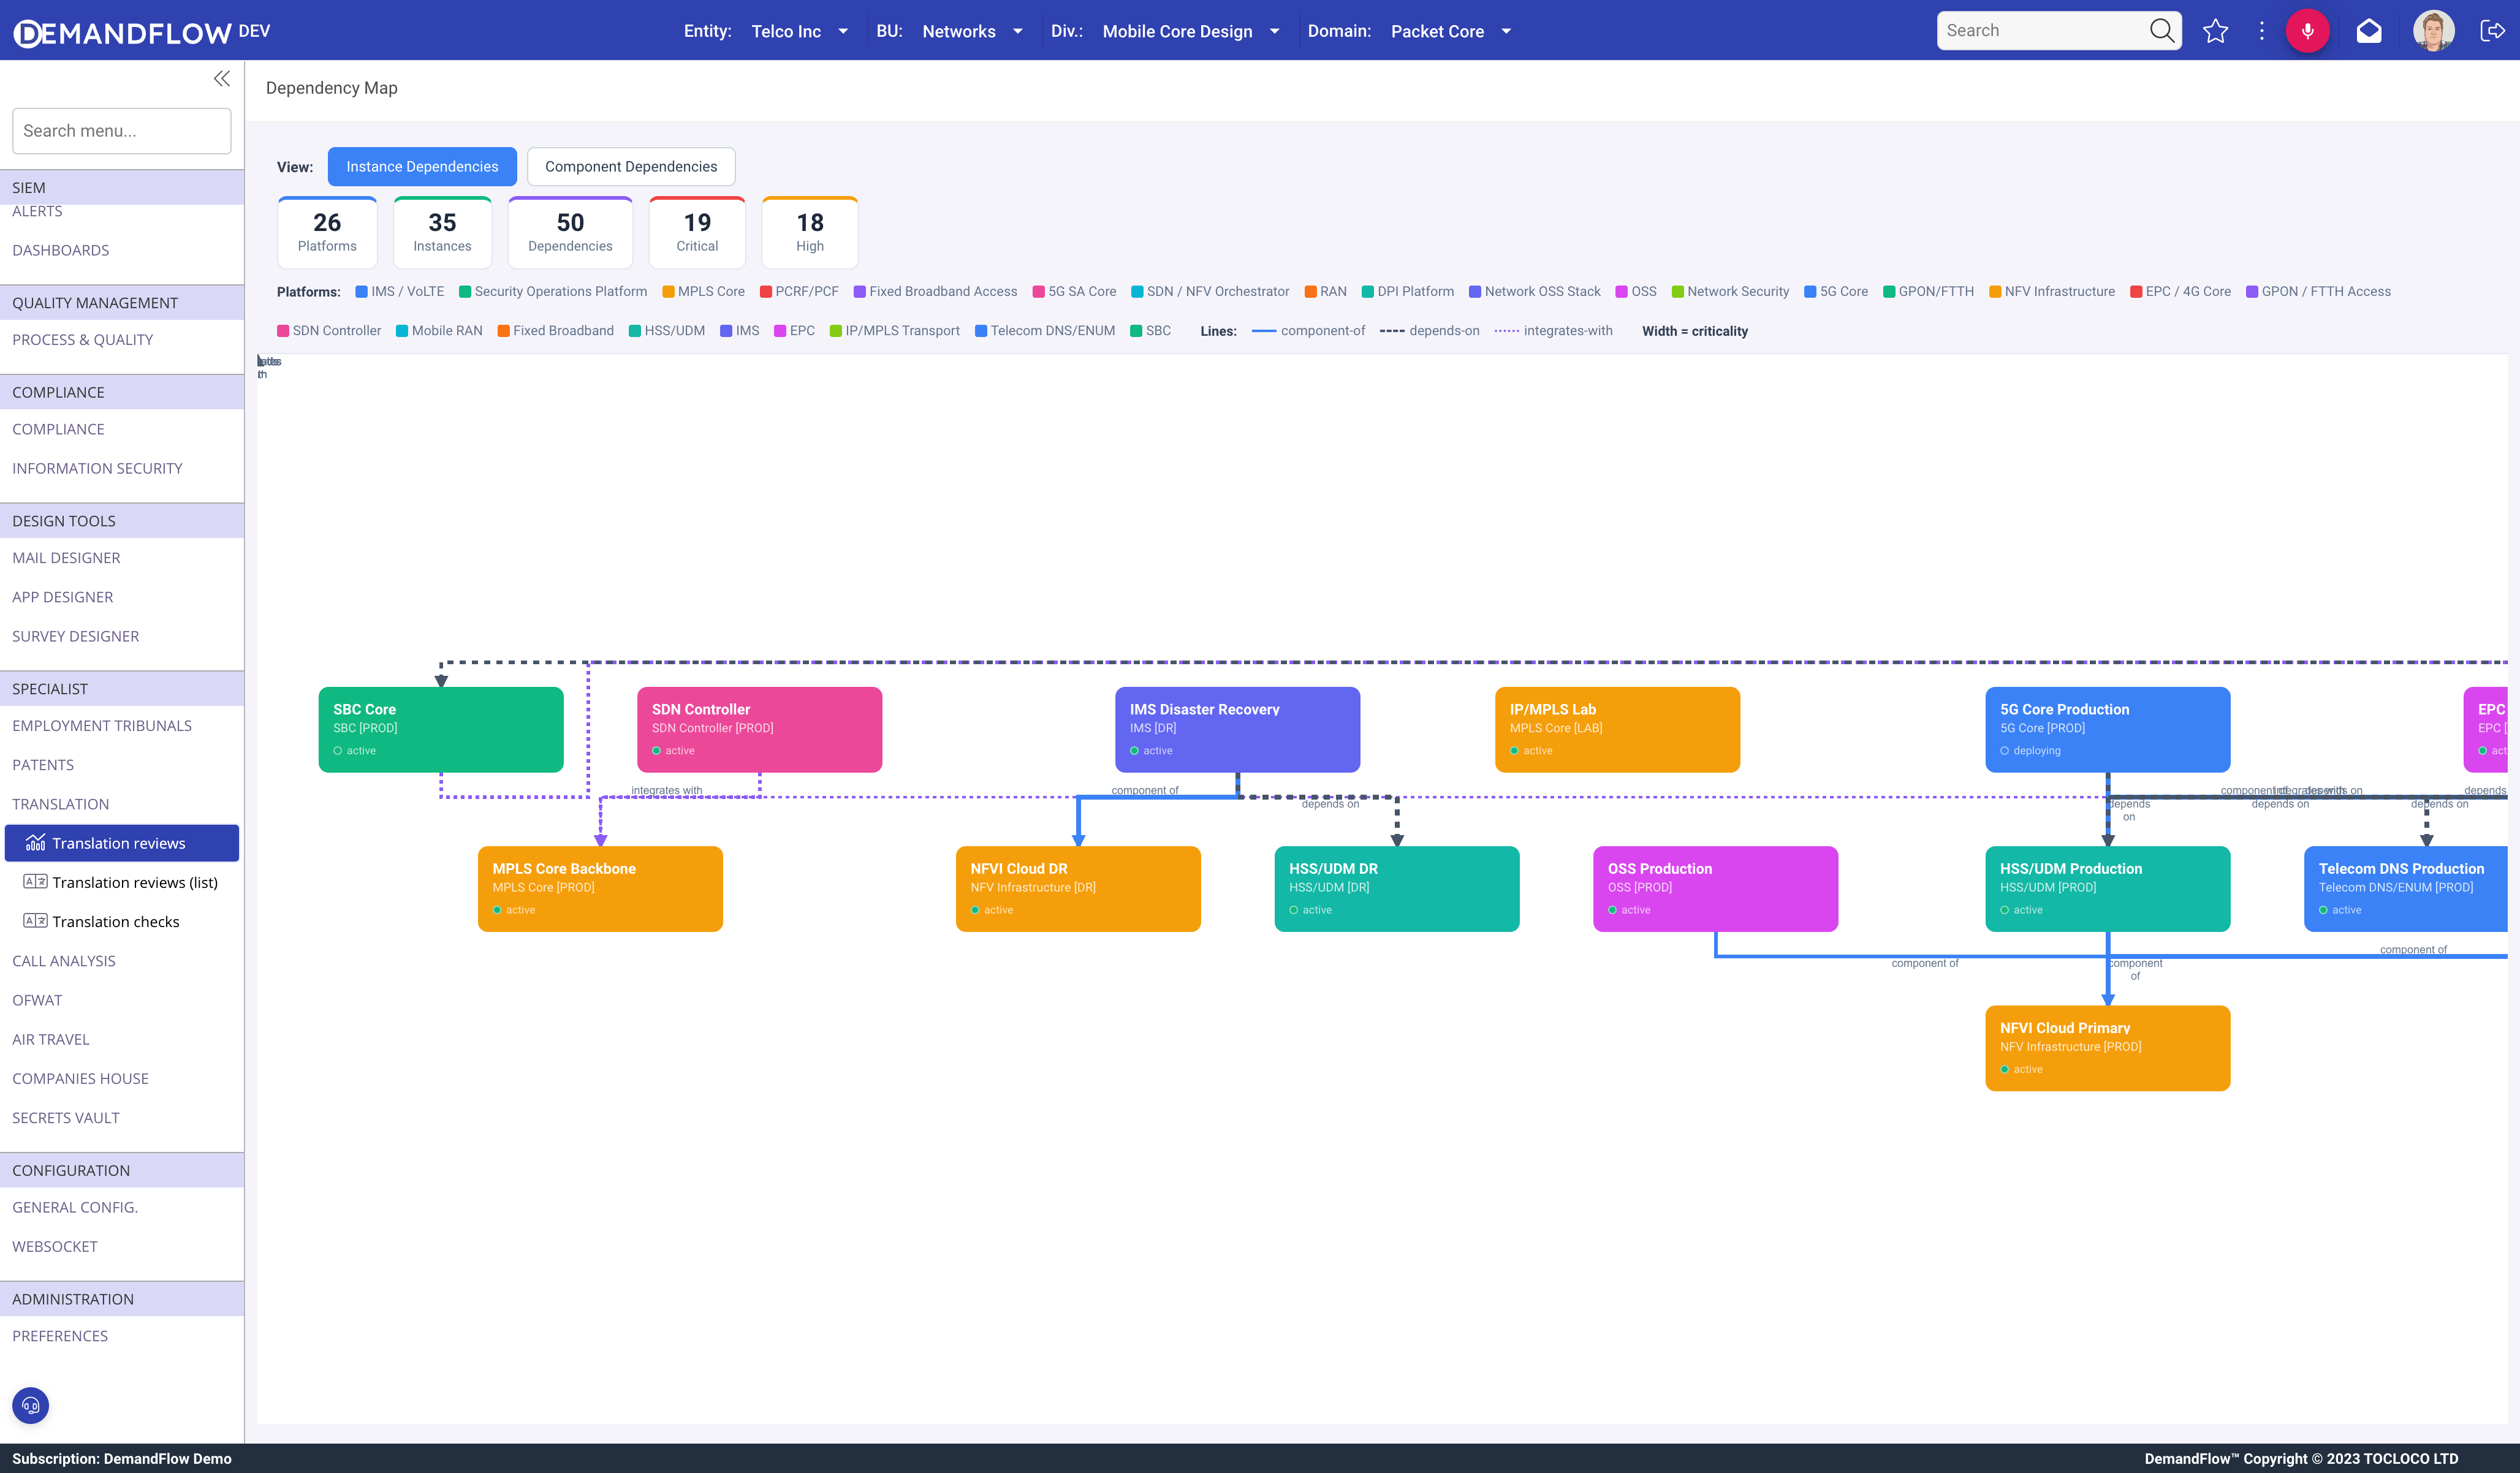
The global dependency map (Telecom platforms > Dependency map) visualises all platform instances and their relationships on a single interactive graph:
- Nodes are colour-coded by status: planned (grey), deploying (blue), active (green), deprecated (amber), decommissioning (red), retired (grey).
- Node size reflects criticality.
- Lines show dependency direction: solid for "depends on", dashed for "component of", dotted for "integrates".
- Summary cards at the top show total platforms, instances, dependencies, critical, and high counts.
- Platform type checkboxes let you filter the view to specific technologies.
Impact Analysis
The Impact Analysis toolbar action on any platform instance recursively walks the dependency graph (up to depth 5) to find every platform that depends on it, both directly and transitively. The output shows:
- The cascade of affected platforms at each depth level.
- Network services referencing affected platforms.
- The total blast radius of an outage on this instance.
Use this before planned maintenance windows or decommissions to understand the full impact.
Tips
- Always record mitigations for critical dependencies. This information is invaluable during incident response.
- Run Impact Analysis before any planned outage to identify stakeholders who need to be notified.
- Use the dependency map regularly to spot single points of failure: platforms with many inbound dependencies and no redundancy.