The Network Platform Dashboard (Telecom platforms > Network dashboard) provides a fleet-wide view of your telecom platform estate.
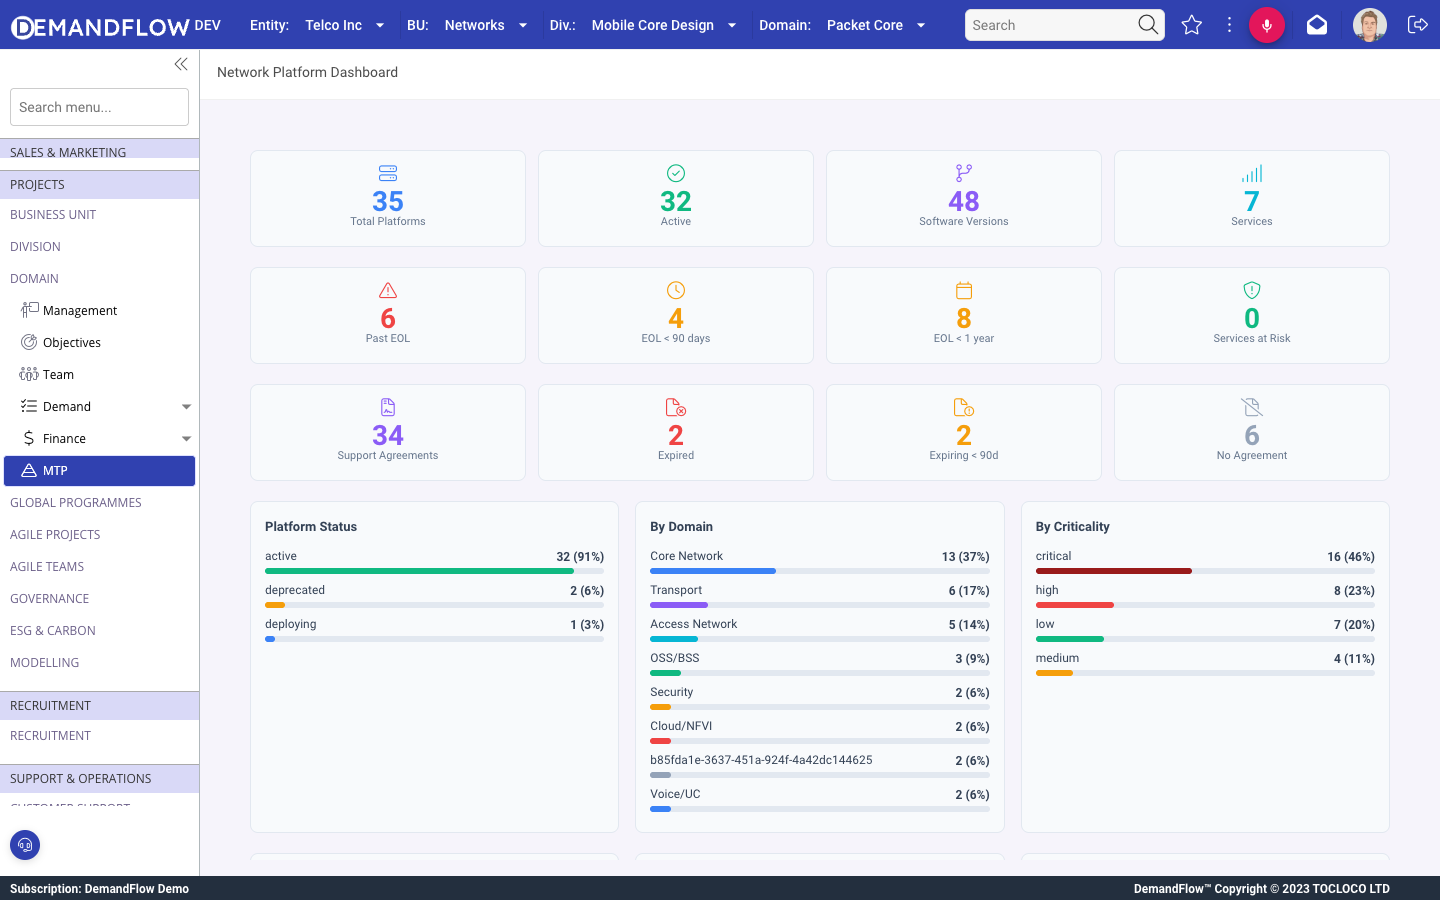
KPI cards
Three rows of summary cards:
Top row (fleet size)
- Total Platforms: all platform instances under management.
- Active: instances with Active status.
- Software Versions: total software version records tracked.
- Services: network services linked to platforms.
Middle row (EOL risk)
- Past EOL: versions that have already passed their end-of-life date. Requires immediate attention.
- EOL within 90 days: versions approaching end of life. Plan upgrades now.
- EOL within 1 year: versions with end of life in the next 12 months. Budget and schedule upgrades.
- Services at Risk: network services that depend on platforms running past-EOL software.
Bottom row (support)
- Support Agreements: total active support contracts.
- Expired: support agreements that have lapsed.
- Expiring within 90 days: agreements approaching renewal.
- No Agreement: platforms with no support contract linked.
Breakdown charts
- Platform Status: active, deprecated, deploying, retired.
- By Domain: Core Network, Transport, Access Network, OSS/BSS, Security, Cloud/NFVI, Voice/UC.
- By Criticality: critical, high, low, medium (colour-coded bars).
- Deployment Model: Physical, Virtualised, Hybrid, Containerised, Cloud-native.
- By Environment: Production, Lab, Disaster Recovery, Pre-production, Staging.
- Dependencies: total count, critical, high, medium, low.
Tips
- Check the dashboard weekly. The EOL risk cards surface problems that are invisible in day-to-day operations.
- The "Services at Risk" count is the most actionable metric: it tells you which customer-facing services are running on expired software.
- Use "No Agreement" to identify platforms that lack vendor support coverage. These are unprotected if something goes wrong.