SIEM dashboards give you a running view of what is happening across your log sources. Create them once in the designer, then pin them to the Dashboards screen for daily use.
View an existing dashboard
Go to SIEM > Dashboards. Pick a dashboard from the selector in the toolbar. The tiles render against live data.
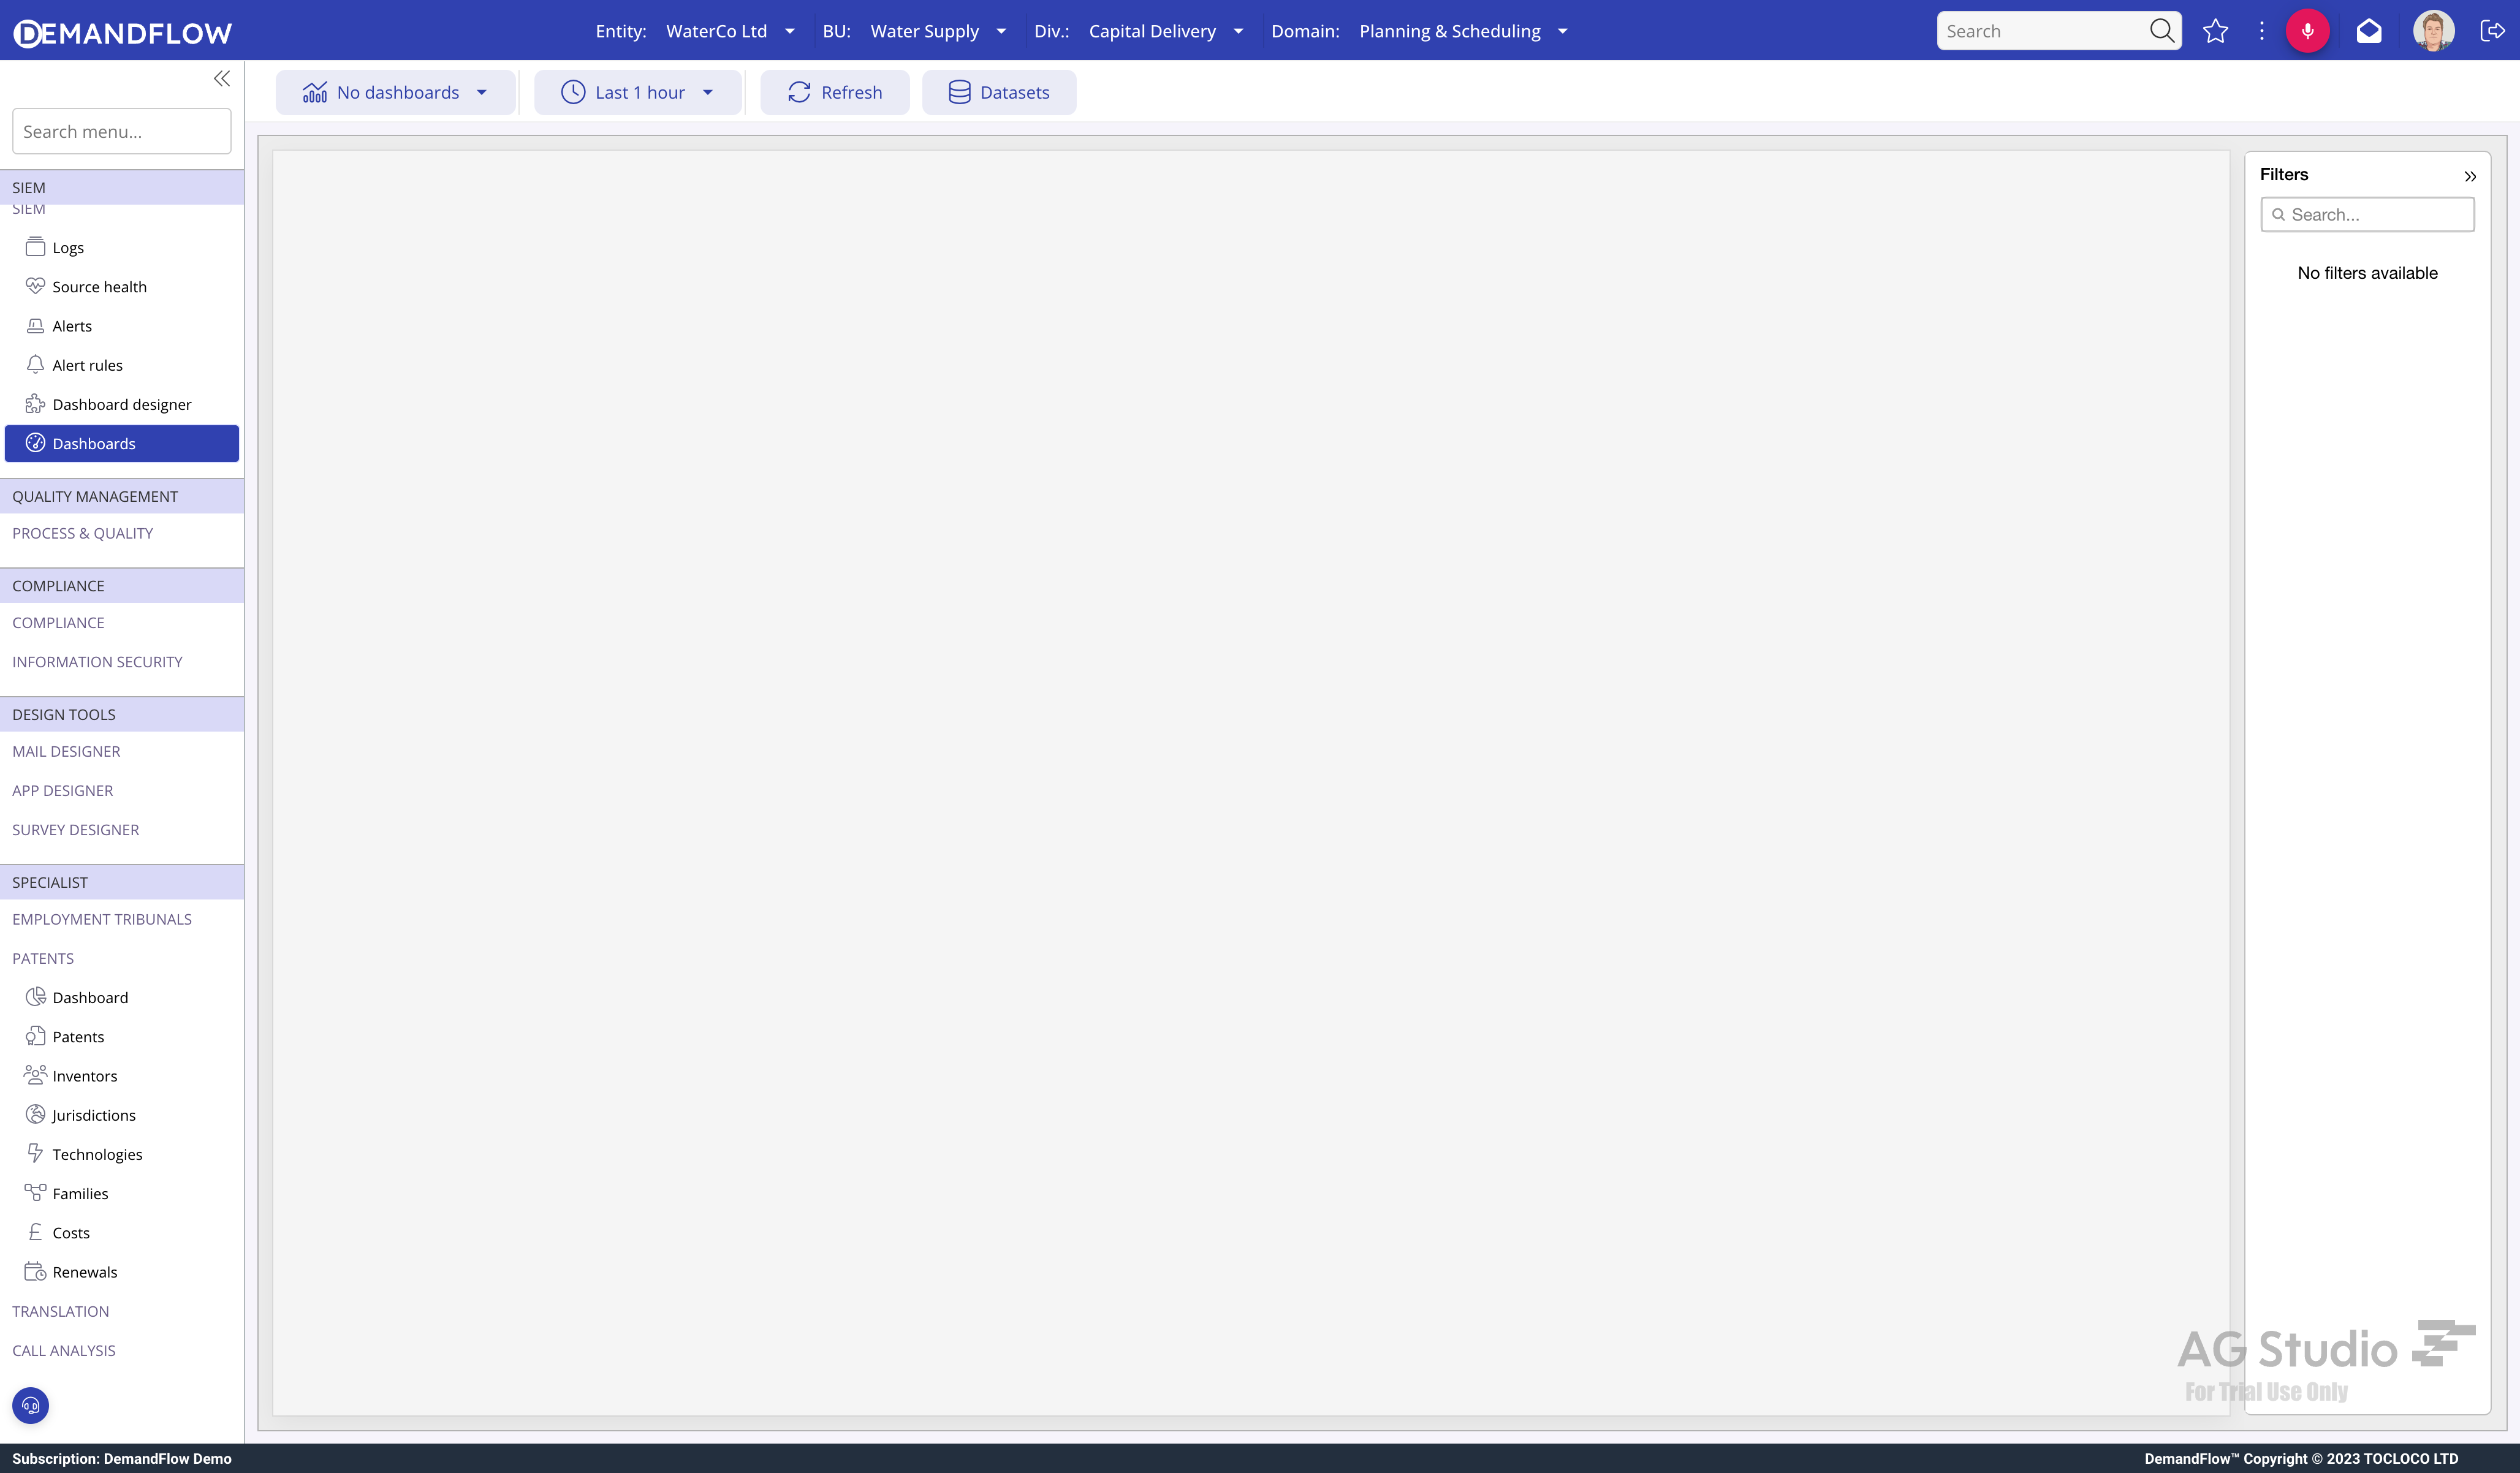
Use the time-range selector to change the window. The default is the last hour; switch to longer windows for trend views. Note that log event queries are bounded by that window so very long ranges with a noisy tenant may take a moment to render.
Build a new dashboard
Go to SIEM > Dashboard designer.
- Click New dashboard.
- Give it a clear name.
- Add tiles from the tile picker. Each tile has a dataset (LOGSOURCE or LOG), a visualisation type (KPI number, bar, line, pie, grid), and filters.
- Drag to arrange the tiles.
- Save.
Common tiles to start with:
- Events per hour: line chart of log event counts over time.
- Top sources: bar chart ranking sources by event count.
- Severity breakdown: pie of events by severity.
- Silent sources: grid of log sources whose last-seen exceeds a threshold.
- Recent alerts: grid of the most recent alert records, grouped by status.
Share a dashboard
SIEM dashboards are stored as SIEMDASH records in the tenant and are available to any admin with SIEM access. They do not appear in the non-SIEM dashboard picker, so they will not leak into FinOps or operational dashboards.
Tips
- Keep a morning check dashboard small and focused: silent sources, yesterday's event volume, open alerts.
- Have a second deeper dashboard per domain (auth, network, app) with more filter-heavy tiles.
- Don't build one giant dashboard. Two small focused boards are easier to read and easier to update.
What to do next
If notifications are the last piece of the puzzle, see Using integration flows for SIEM notifications.