Overview
The Dashboard row type creates an interactive grid layout of visual panels within a record. Dashboards are used to present data visualisations, summary metrics, charts, and other graphical content in a structured, tile-based layout.
When to Use
Use the Dashboard row type when you need to:
- Present visual summaries of data related to the current record
- Display multiple charts, metrics, or KPI blocks in a grid arrangement
- Create overview screens that aggregate information from child records
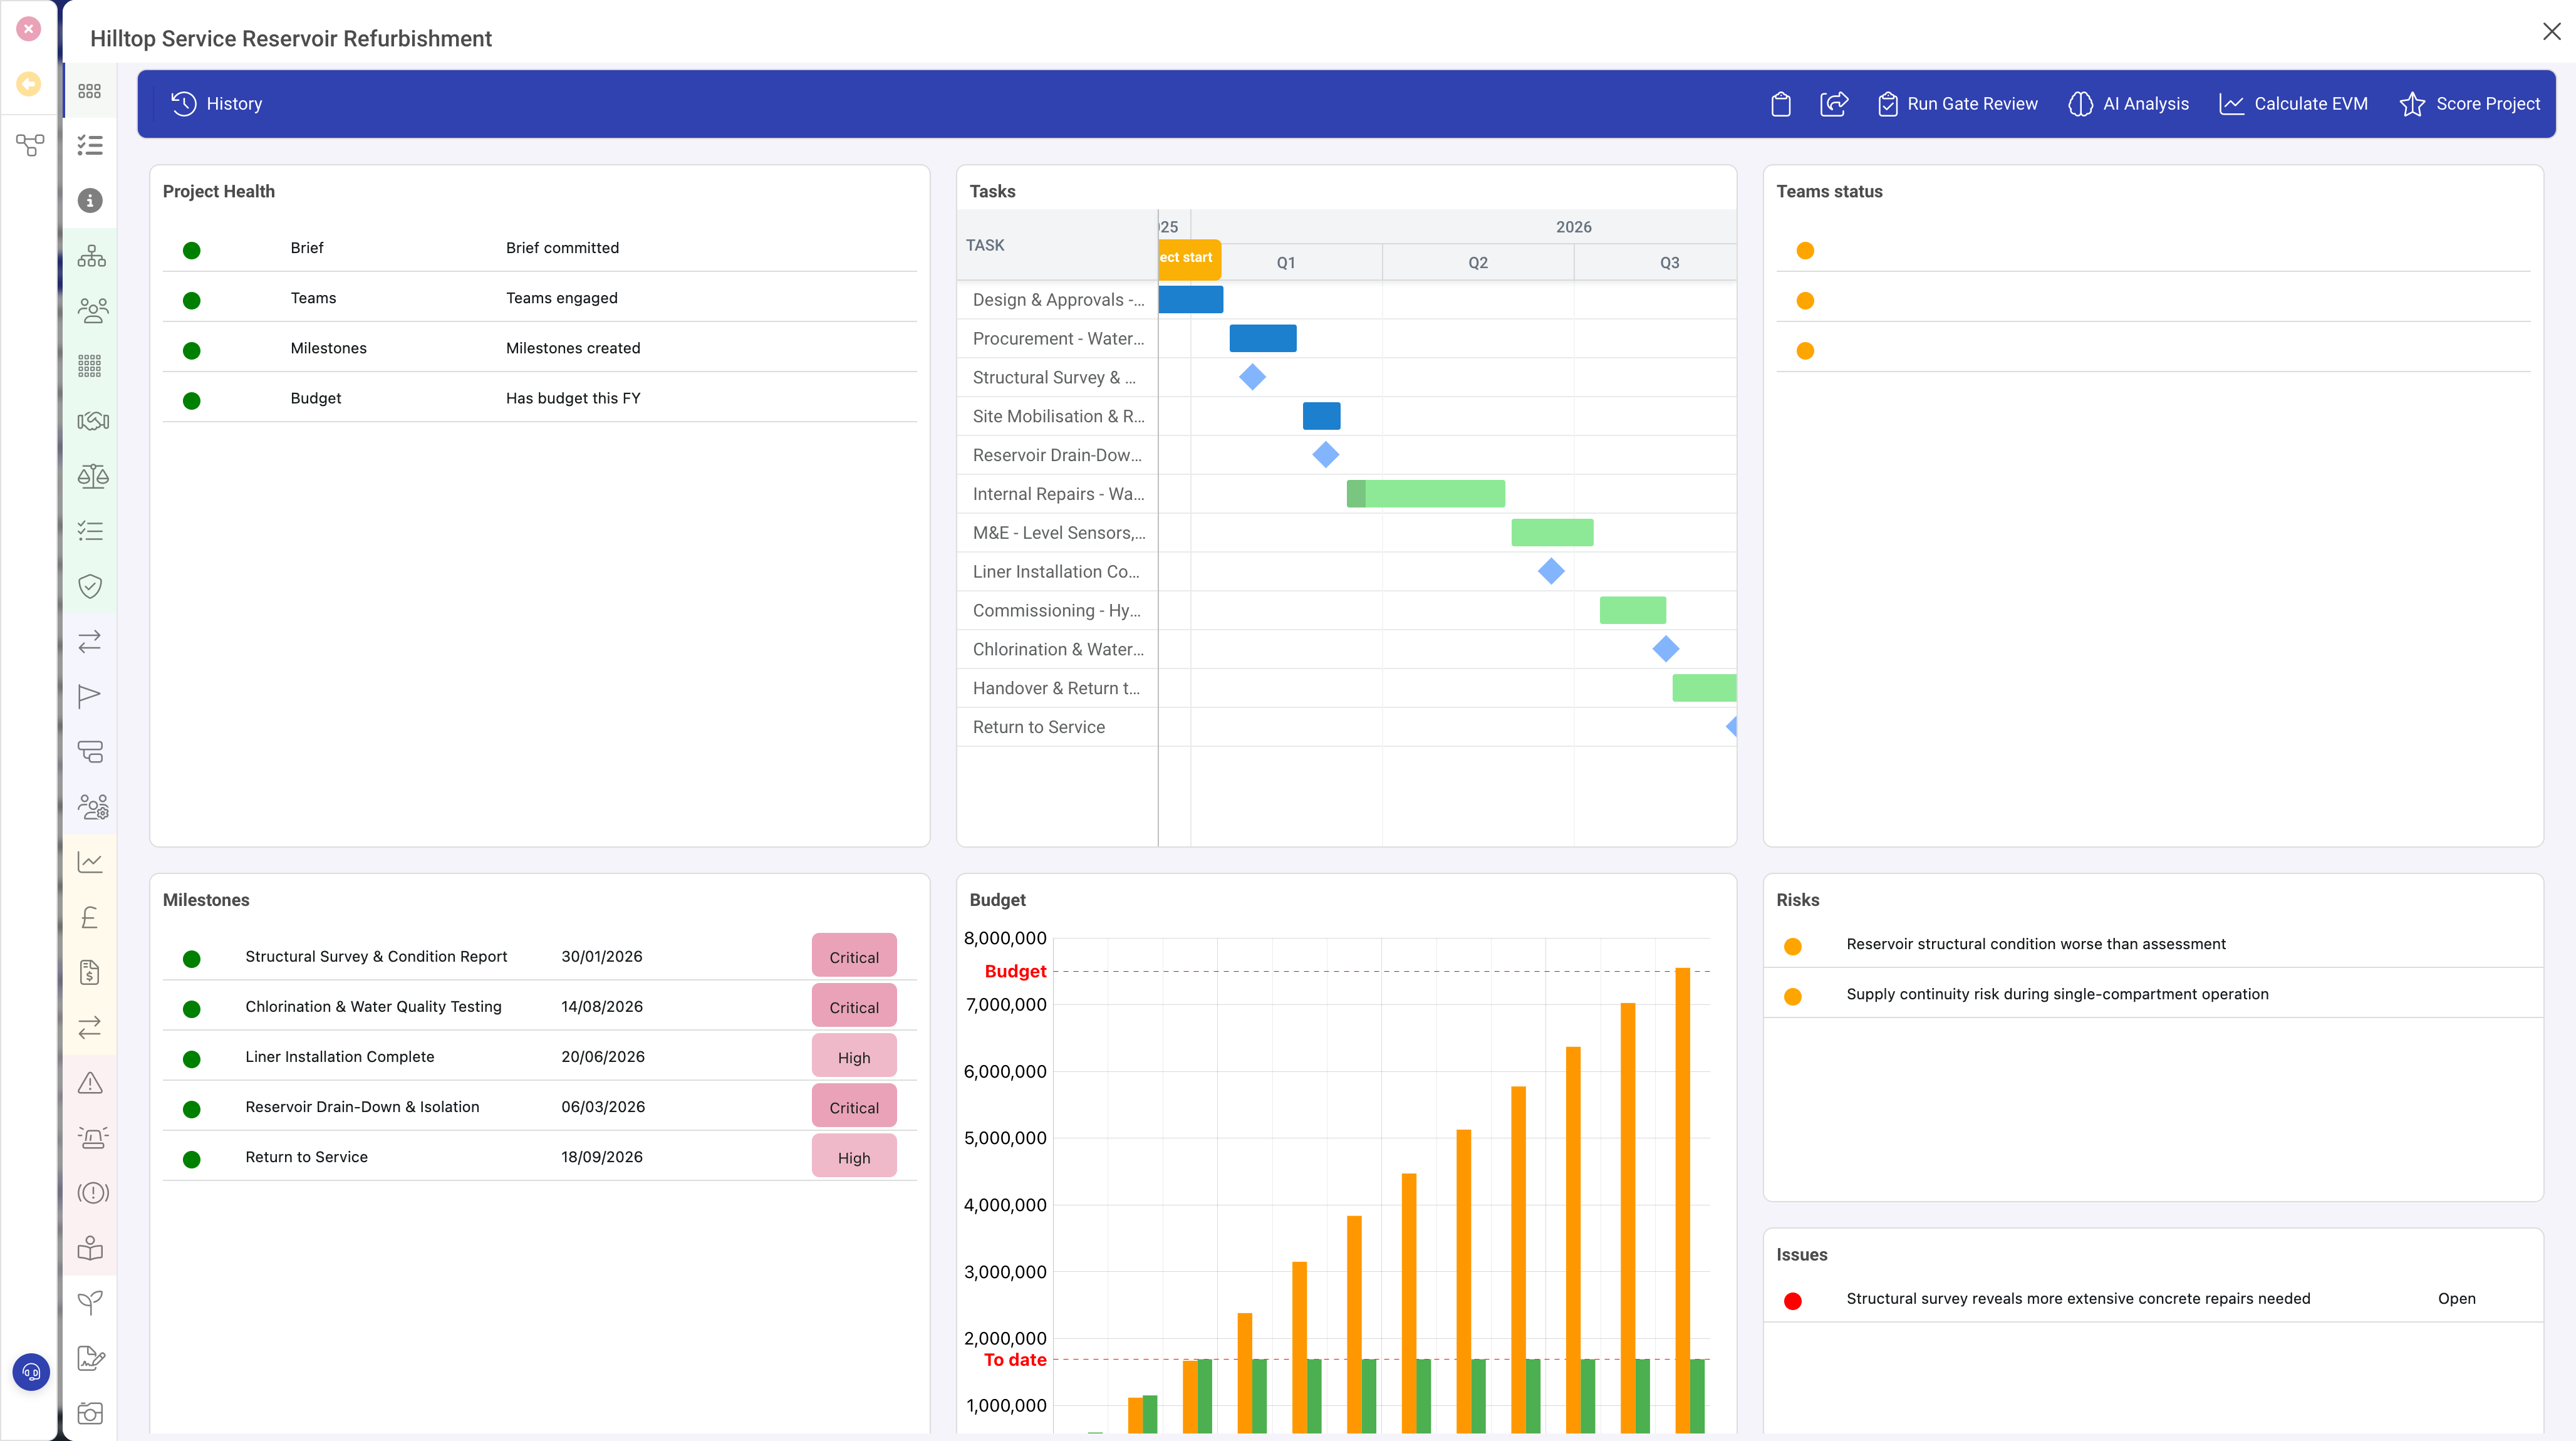
- Provide at-a-glance status views for projects, portfolios, or programmes
Properties
| Property | Required | Description |
|---|---|---|
| Type | Yes | Must be set to dashboard |
| Columns | Yes | The number of columns in the dashboard grid. Determines the horizontal resolution of the layout. Common values are 6, 8, or 12. |
| Rows | Yes | The number of rows in the dashboard grid. Determines the vertical resolution of the layout. |
| Panels | Yes | An array of panel definitions. Each panel occupies a rectangular area within the grid and displays specific content. |
| Moveable | No | When set to true, users can drag panels to rearrange the dashboard layout. |
| Resizable | No | When set to true, users can resize panels by dragging their edges. |
| Background | No | A background colour or style for the dashboard area. |
| Visibility | No | A condition controlling when this dashboard is visible. |
Panel Configuration
Each panel in the dashboard's Panels array defines a content block. Panels are positioned using a coordinate system based on the grid dimensions:
| Property | Description |
|---|---|
| Size X | The width of the panel in grid columns |
| Size Y | The height of the panel in grid rows |
| X | The starting column position (optional; panels auto-flow when not specified) |
| Y | The starting row position (optional) |
| Header | A title displayed at the top of the panel |
| Block Type | The type of content displayed in the panel (e.g. chart, metric, custom) |
| Function | The function that renders the panel's content |
Grid Layout Example
With a dashboard configured as 8 columns by 5 rows:
- A panel with Size X: 4, Size Y: 2 occupies half the width and two-fifths of the height
- A panel with Size X: 8, Size Y: 3 spans the full width and three-fifths of the height
- Two panels with Size X: 4 each sit side by side in a single row
Interactive Dashboards
When Moveable and Resizable are enabled, users can personalise the dashboard layout by dragging panels to new positions and resizing them. This allows each user to arrange the dashboard to suit their priorities and screen size.
Best Practices
- Use a dedicated panel (tab) for dashboards, typically named "Dashboard" or "Overview"
- Set the column to 100% width to give the dashboard maximum screen space
- Use the grey background CSS class on the containing panel for a clean visual appearance
- Start with a reasonable grid size (8 columns by 5 rows is a good default) and adjust as needed
- Group related metrics into adjacent panels for easy comparison